
Stops view
The stop overview table offers better task visibility, custom views, filters, temperature columns and direct actions for managing stops efficiently in Qargo.
Introduction
The ‘Stop overview table’ helps users follow up on the most recent stops by giving them an overview within a given time interval. Condensing these stops into a single view gives better visibility of any pending tasks that still need to be executed. This is particularly useful if these tasks are time-sensitive or require approvals.
Terminology
| Term | Definition |
|---|---|
| Stop | A scheduled point where the truck picks up or delivers goods |
| Planned | Planned stops that will happen in the selected time frame |
| Completed | Completed stops within the selected time frame |
| Order number | Unique ID for a customer’s shipment |
| Load number | Unique ID for the truck’s journey, which may include multiple orders |
| Leg / leg activity | A section of a load between two stops (e.g., warehouse to customer) |
| POD (proof of delivery) | Confirmation that goods have been delivered |
| Resources | Vehicles, drivers or equipment assigned to a stop or load |
| Pallet status | Tracking status of pallets (empty, loaded, returned) |
| Additional fields | Extra data fields that can be enabled in the table |
| Filter | Tool to narrow the data shown (e.g., by driver, location or load) |
| Set point (SP) | The requested temperature of a refrigerated load, per zone |
| Actual temperature | The latest telematics reading of the load, shown next to the set point |
Visualization
-
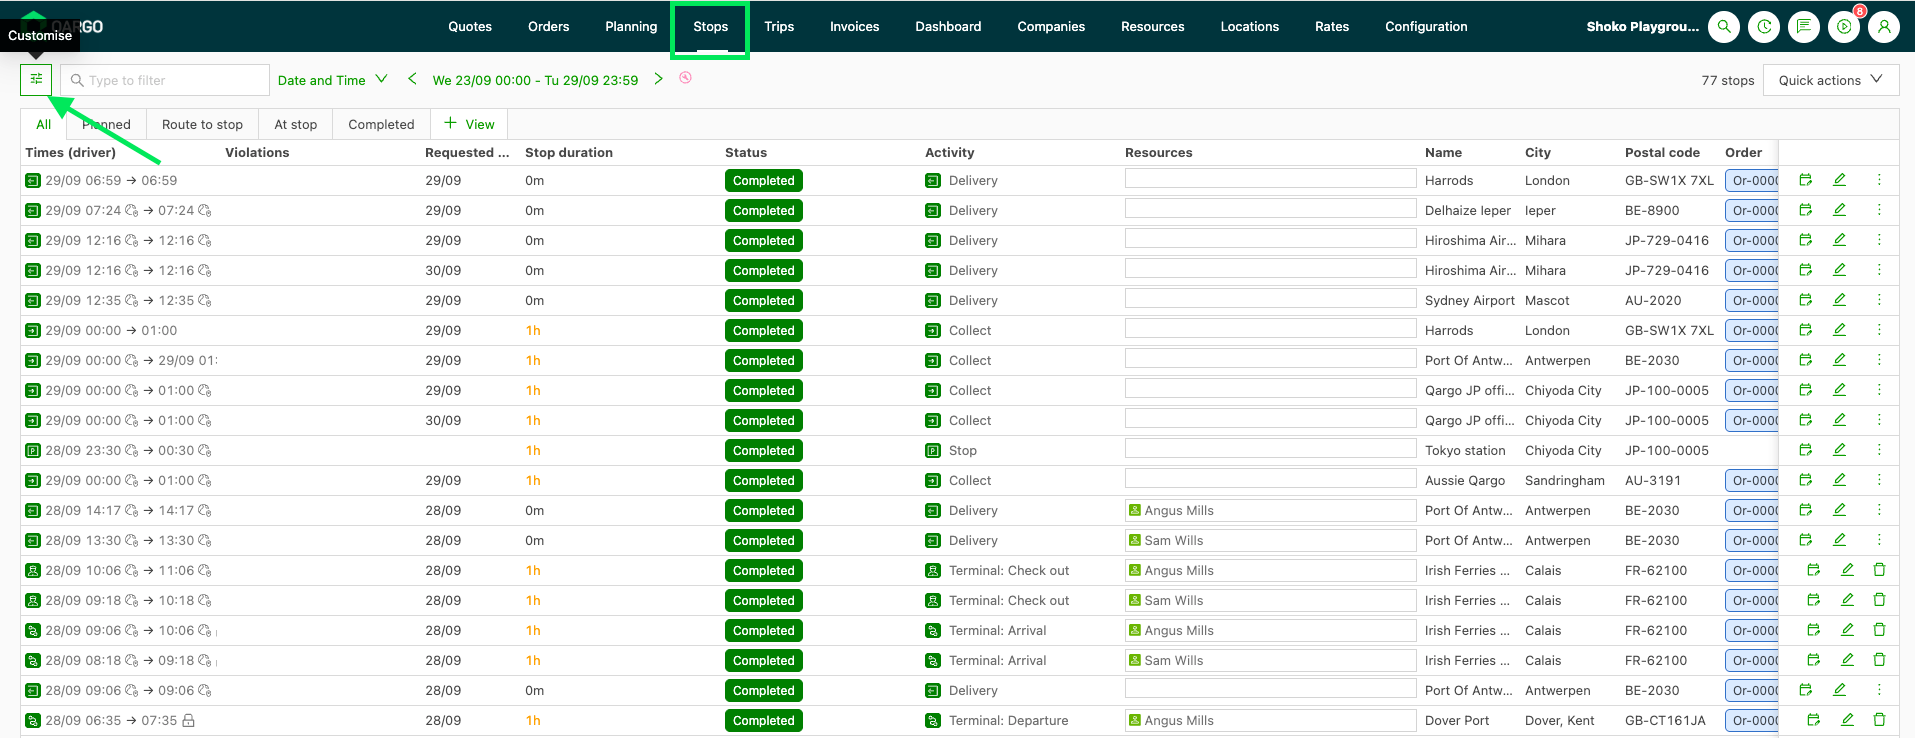
On the list view, 5 default views are available: ‘All’, ‘Planned’, ‘Route to stop’, ‘At stop’ and ‘Completed’.

-
The data displayed in these views depends on the time frame selected in the dropdown option ‘1 day’ or ‘Date and time’.
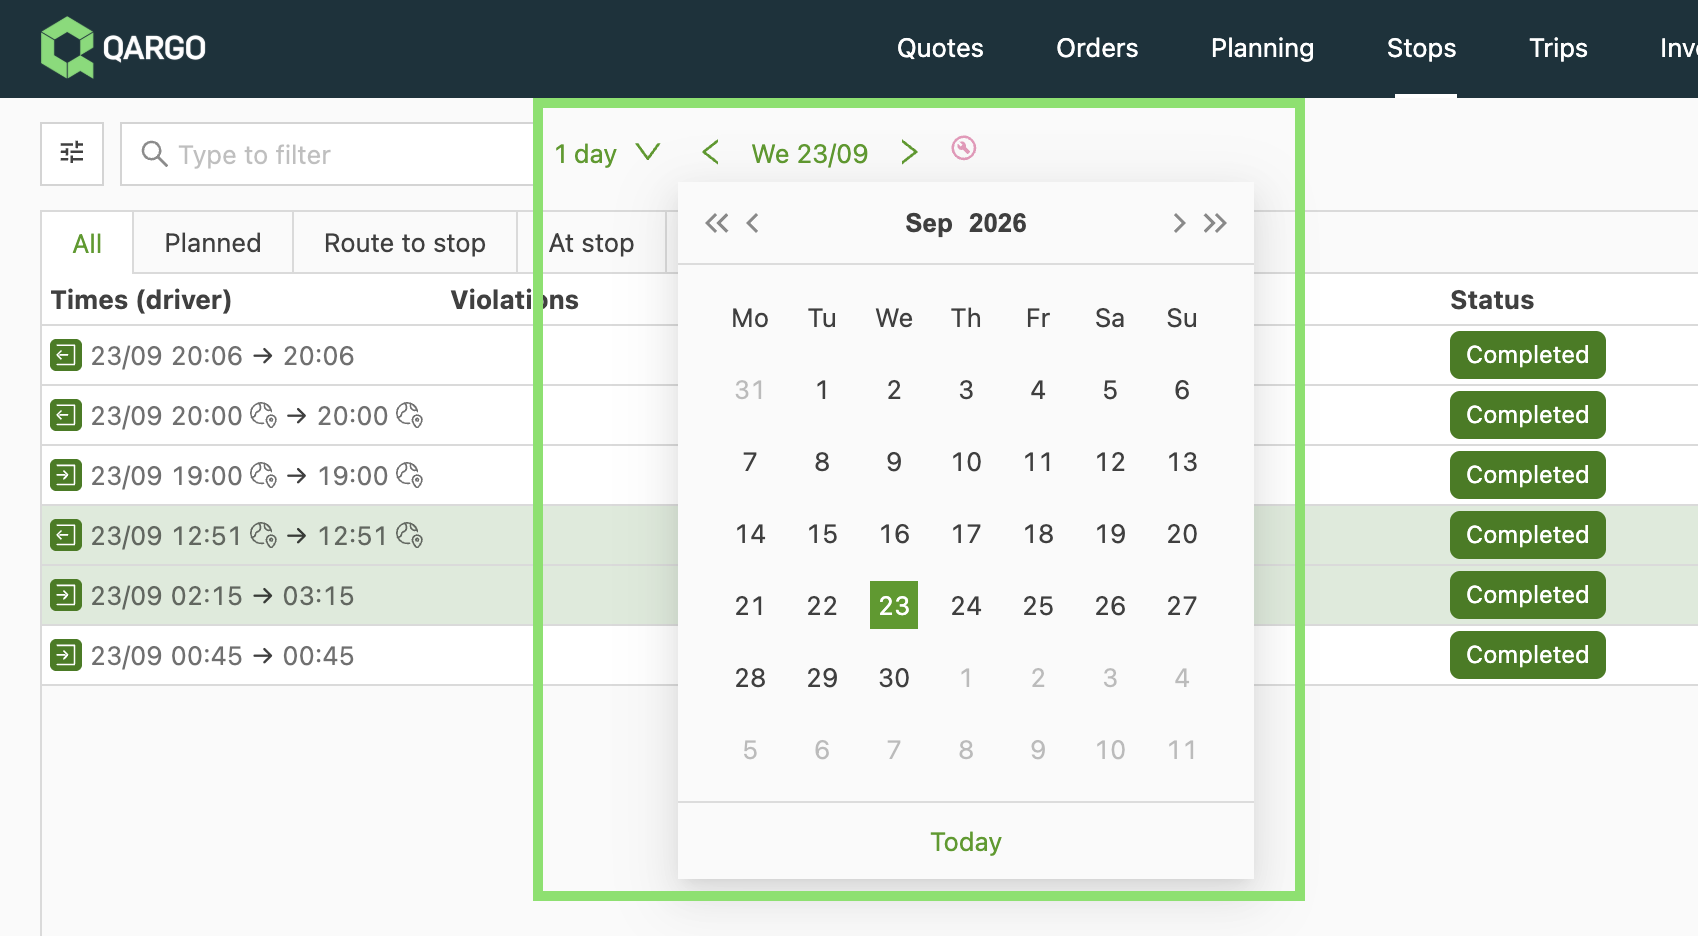
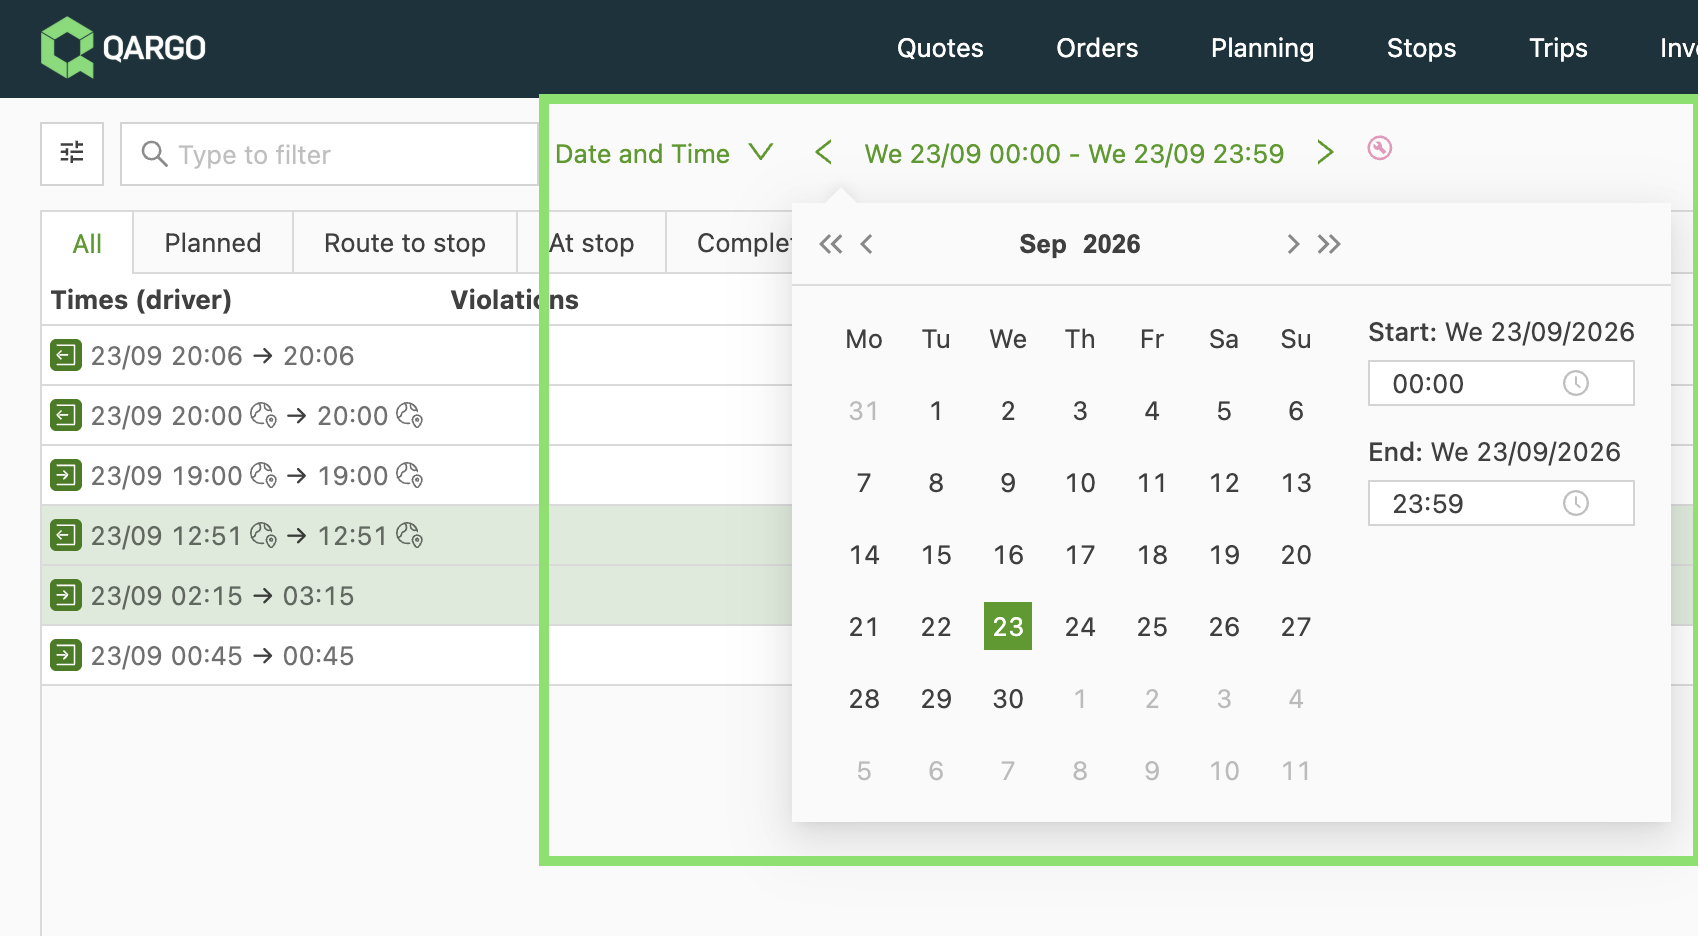
With the time frame selected, the table view displays selected columns such as Times, Status, Resources, Location (e.g., City), Activity, Order, Load, etc. -
Data is sorted by date/time.
-
Arranging the visibility this way makes it possible to show only the fields relevant to the operation and pin them left or right.
-
Use ‘Customize’ to select additional data columns to display in the table.
- Click Customize to open the menu bar, where options can be selected by adjusting the toggle.
- Use the search at the top to filter for specific data.
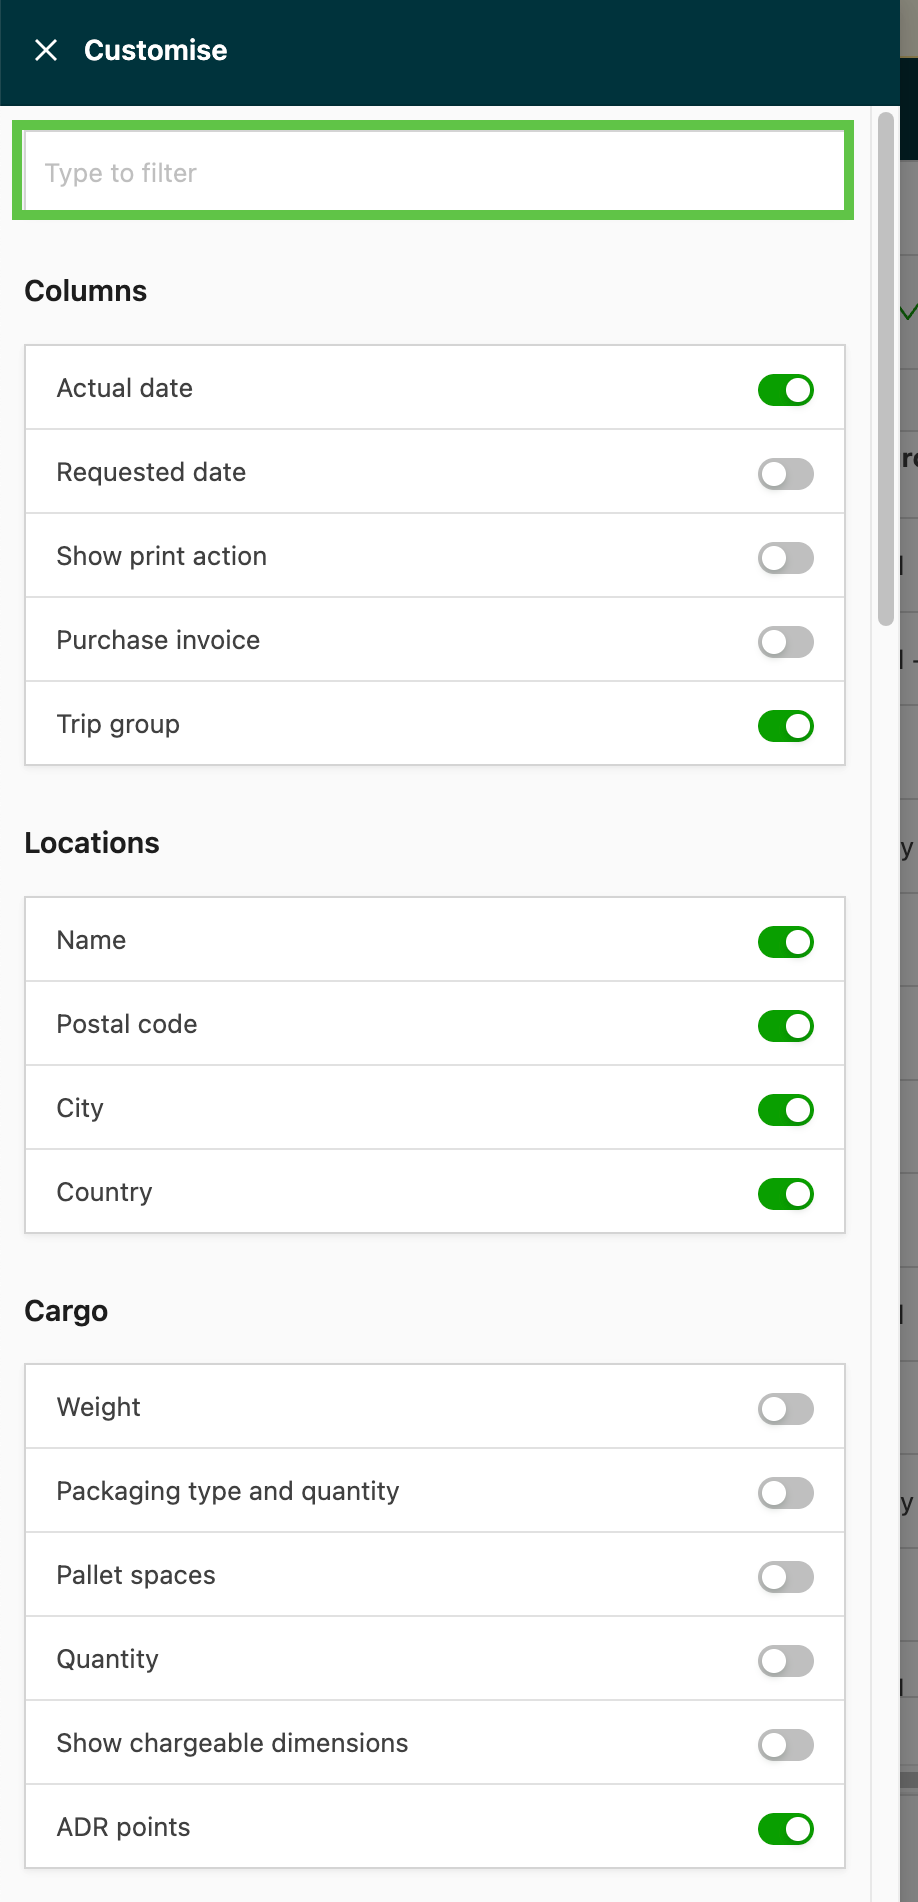
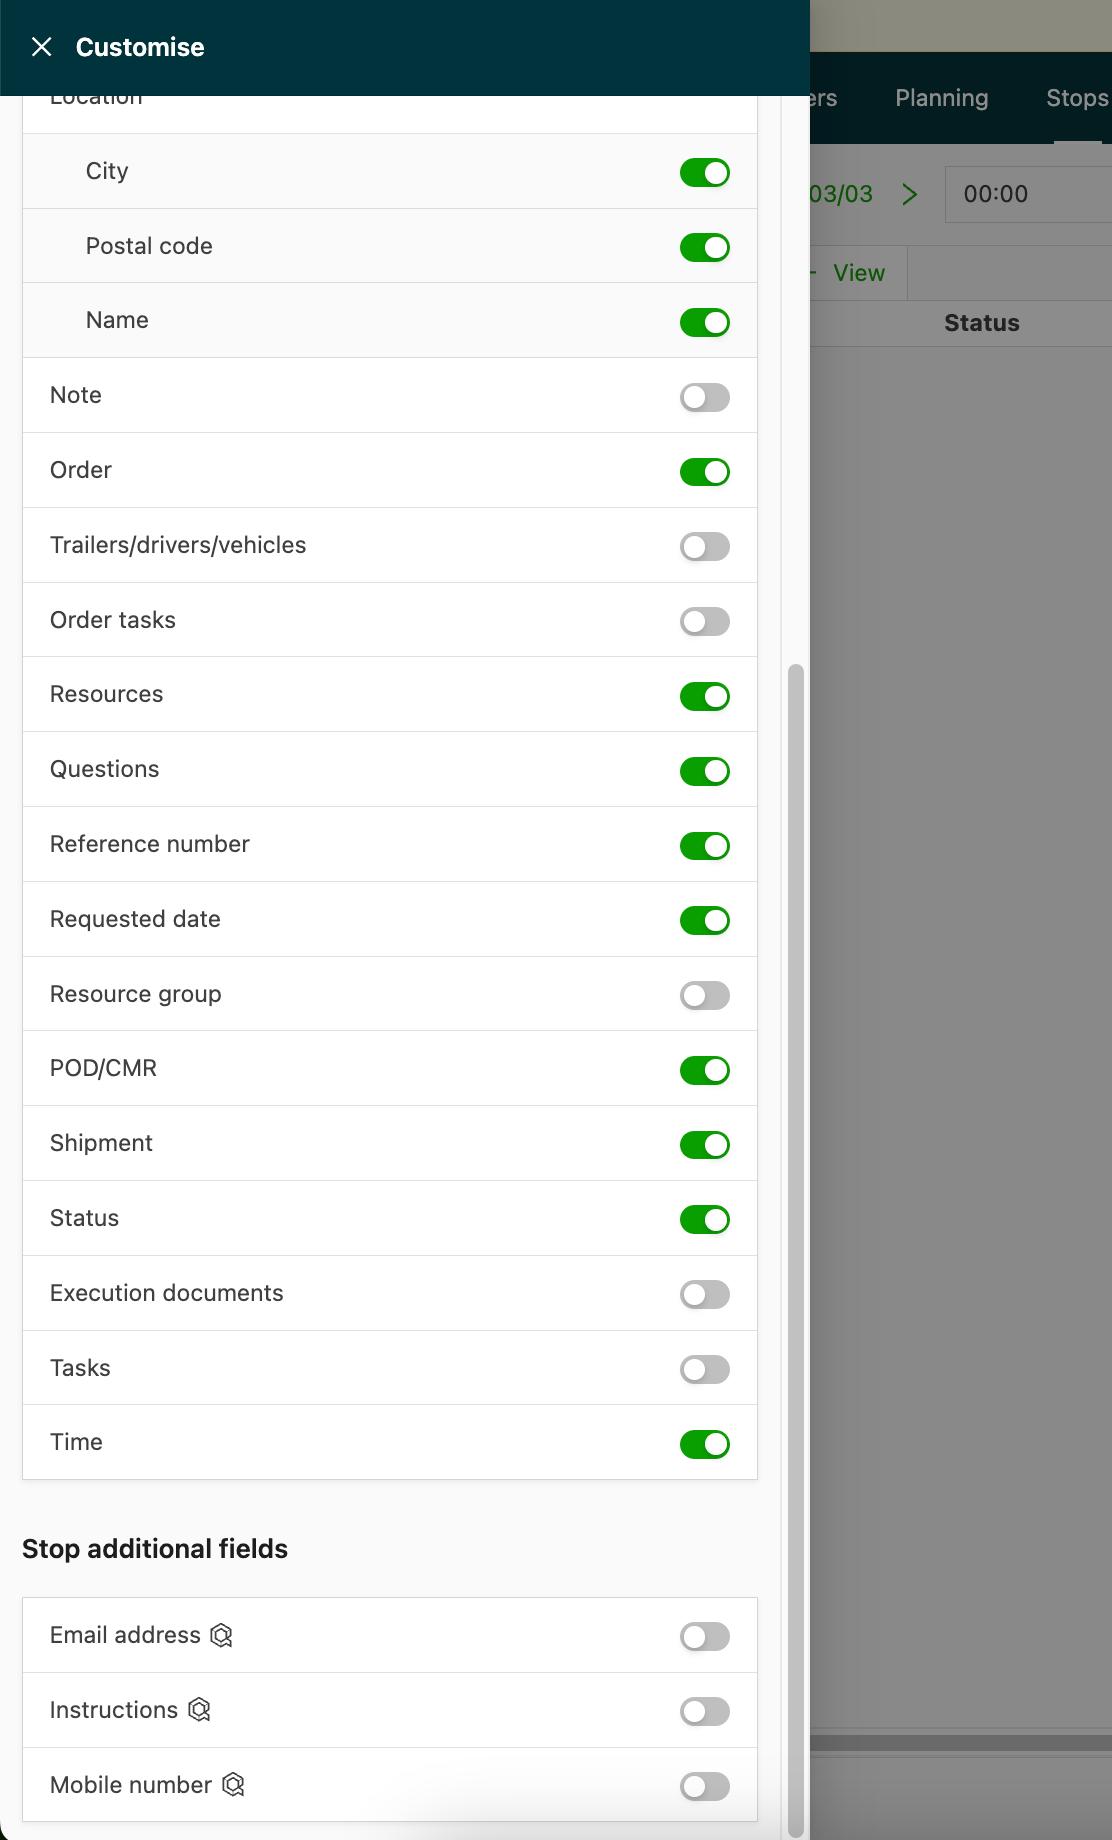
- If ‘Additional fields’ are enabled, they can be set to show from the Customize function.
- To enable additional fields, navigate to Configuration and select the Additional fields option:
- Once enabled in the configuration, these fields can be toggled on/off from the Customize function to show in the view:
-
Columns can be moved in the table by dragging and dropping each column to where the user prefers to see the data.
- Some column headers can be filtered to show selected data. Where this is available, the filter icon is displayed when hovering over the column header.
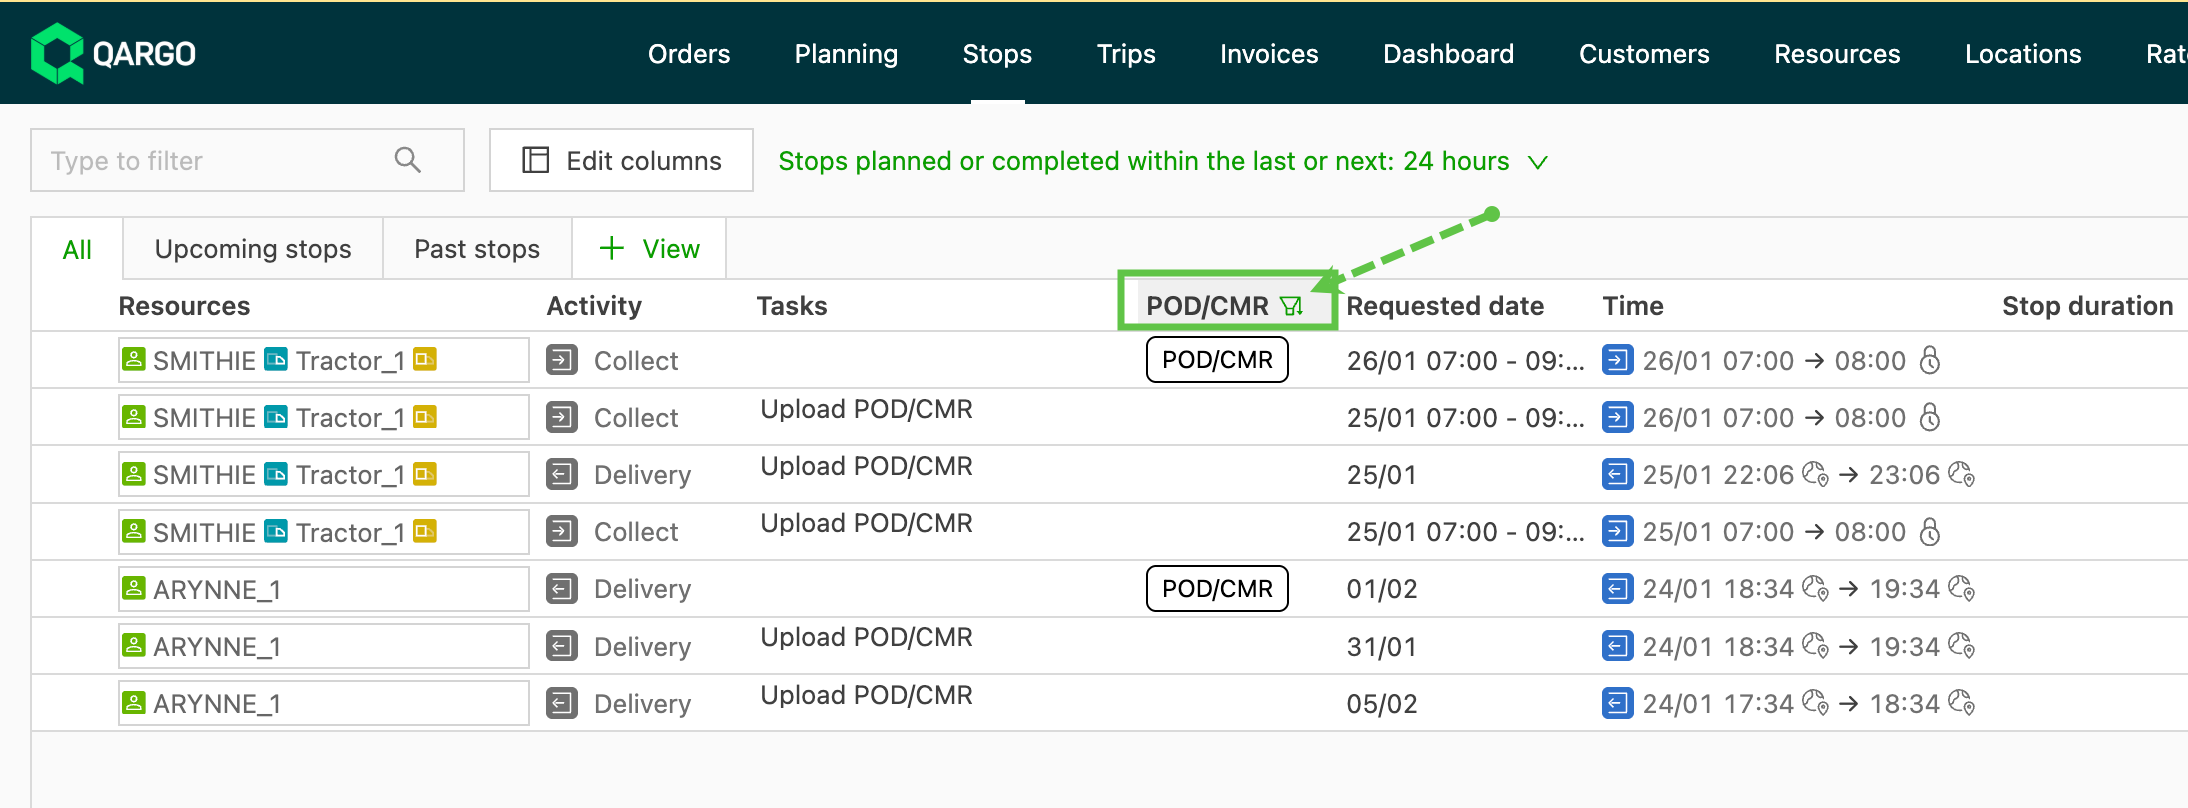
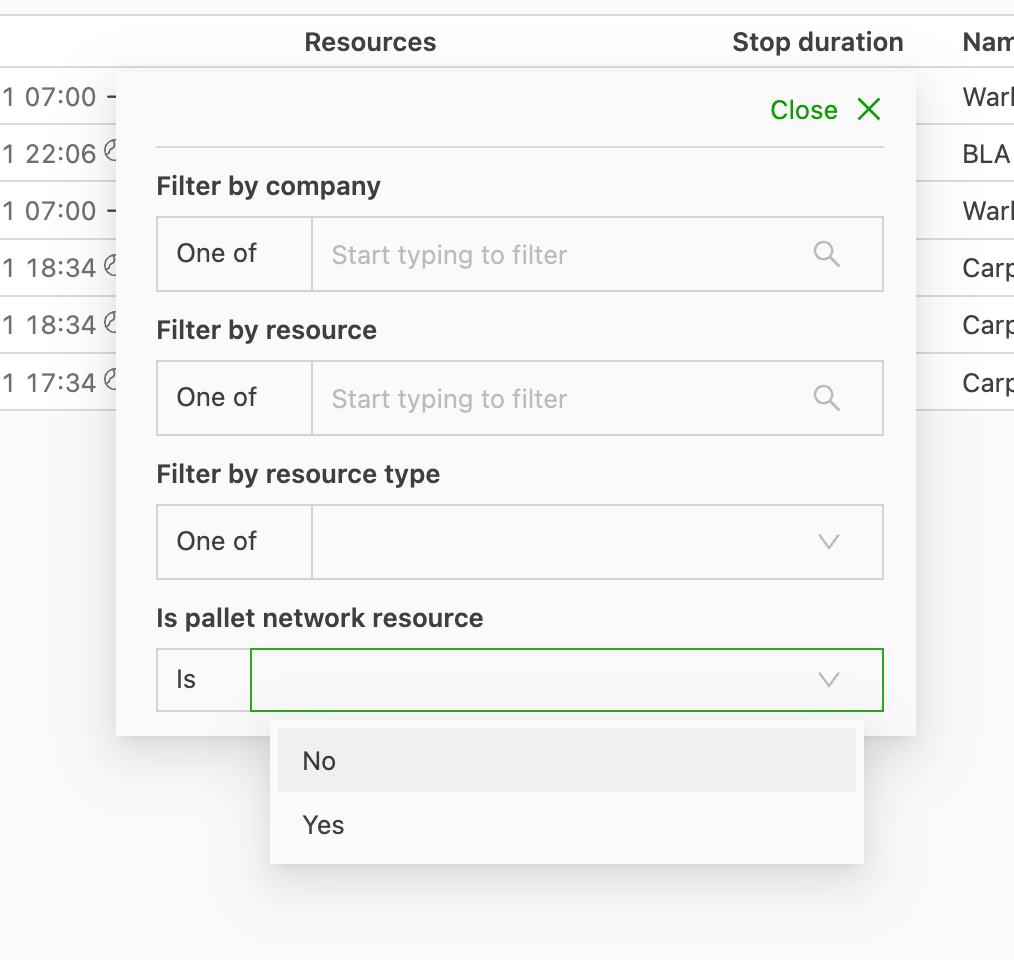
- Filtering options display below the filter icon. Once they are selected, the view adjusts to show the selected options. Use Customize to toggle on/off the columns to view or filter on.
- Filtering on resources can be used to identify key resources or pallet network loads that require additional monitoring.
- Load tasks can be executed directly from the screen by clicking the ‘Play’ button where available.
Order and load detail views can be accessed directly by clicking the number in the row. On the right of each row, 2 additional update options show when available.

-
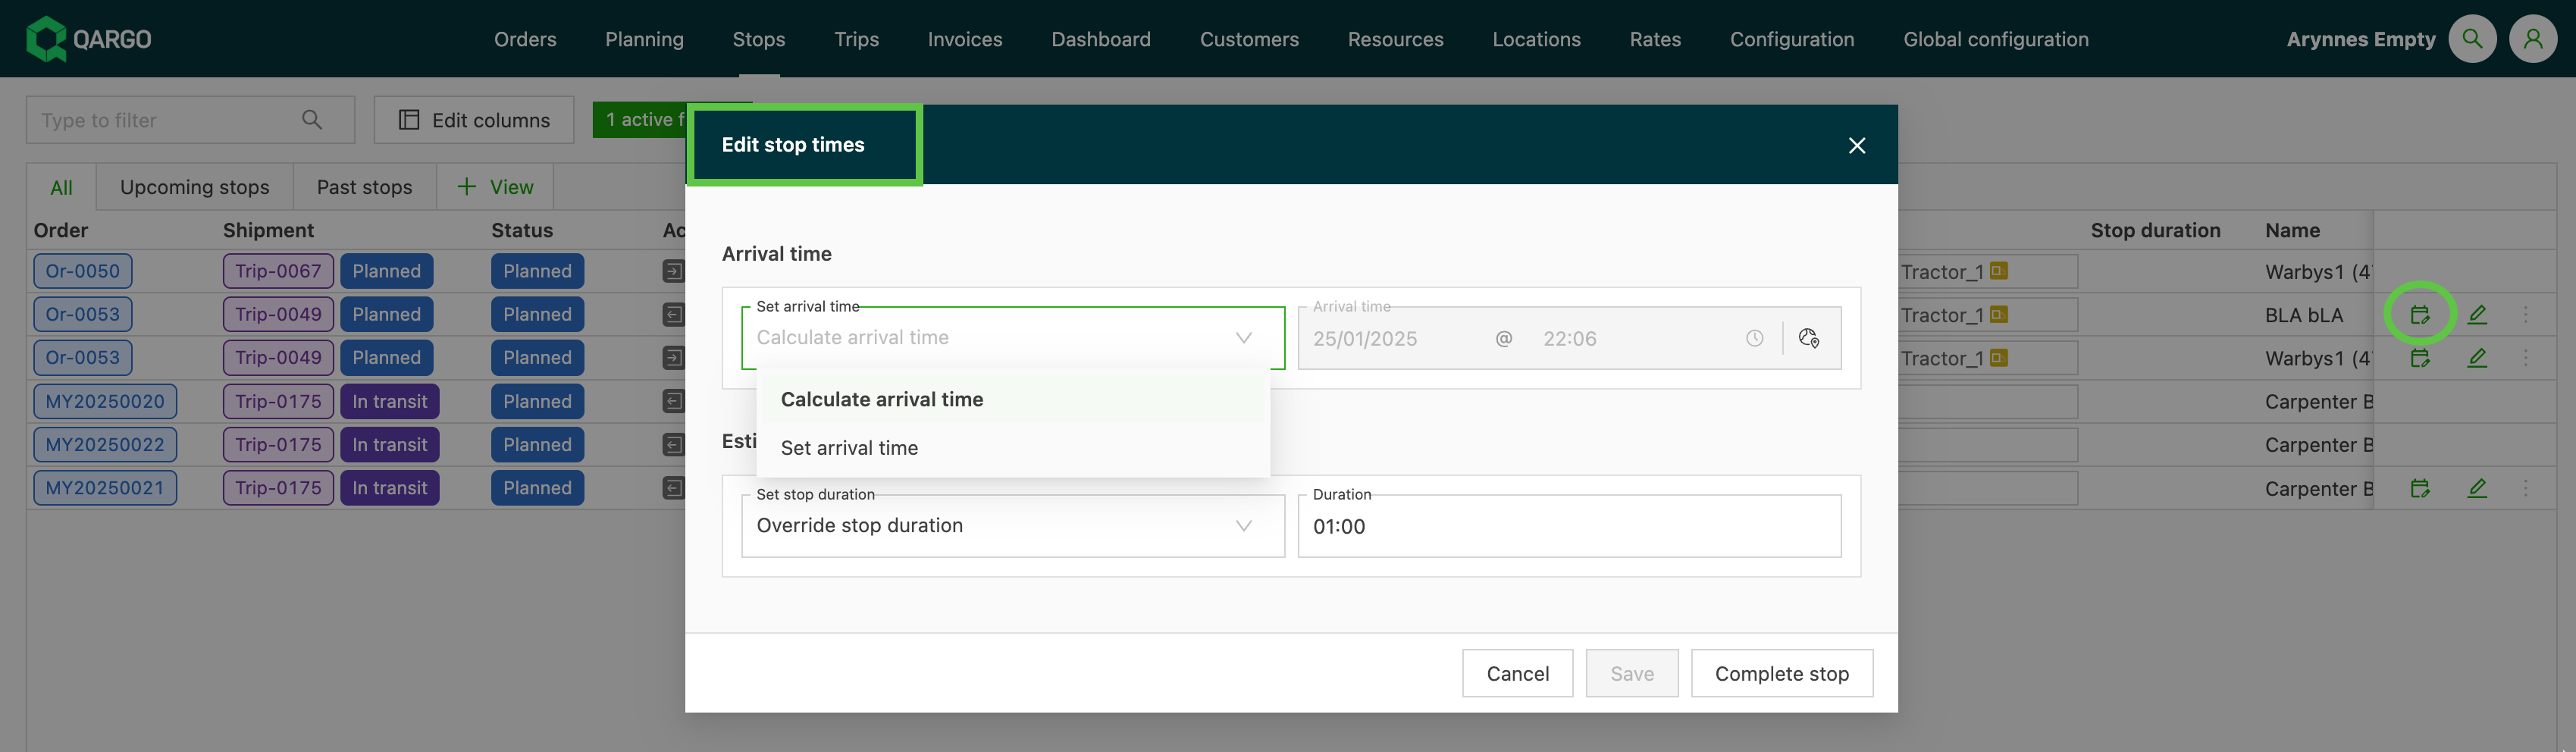
Calendar icon: Edit stop times panel. This allows the user to perform stop actions, including:
-
Complete stop
-
Set arrival time
-
-
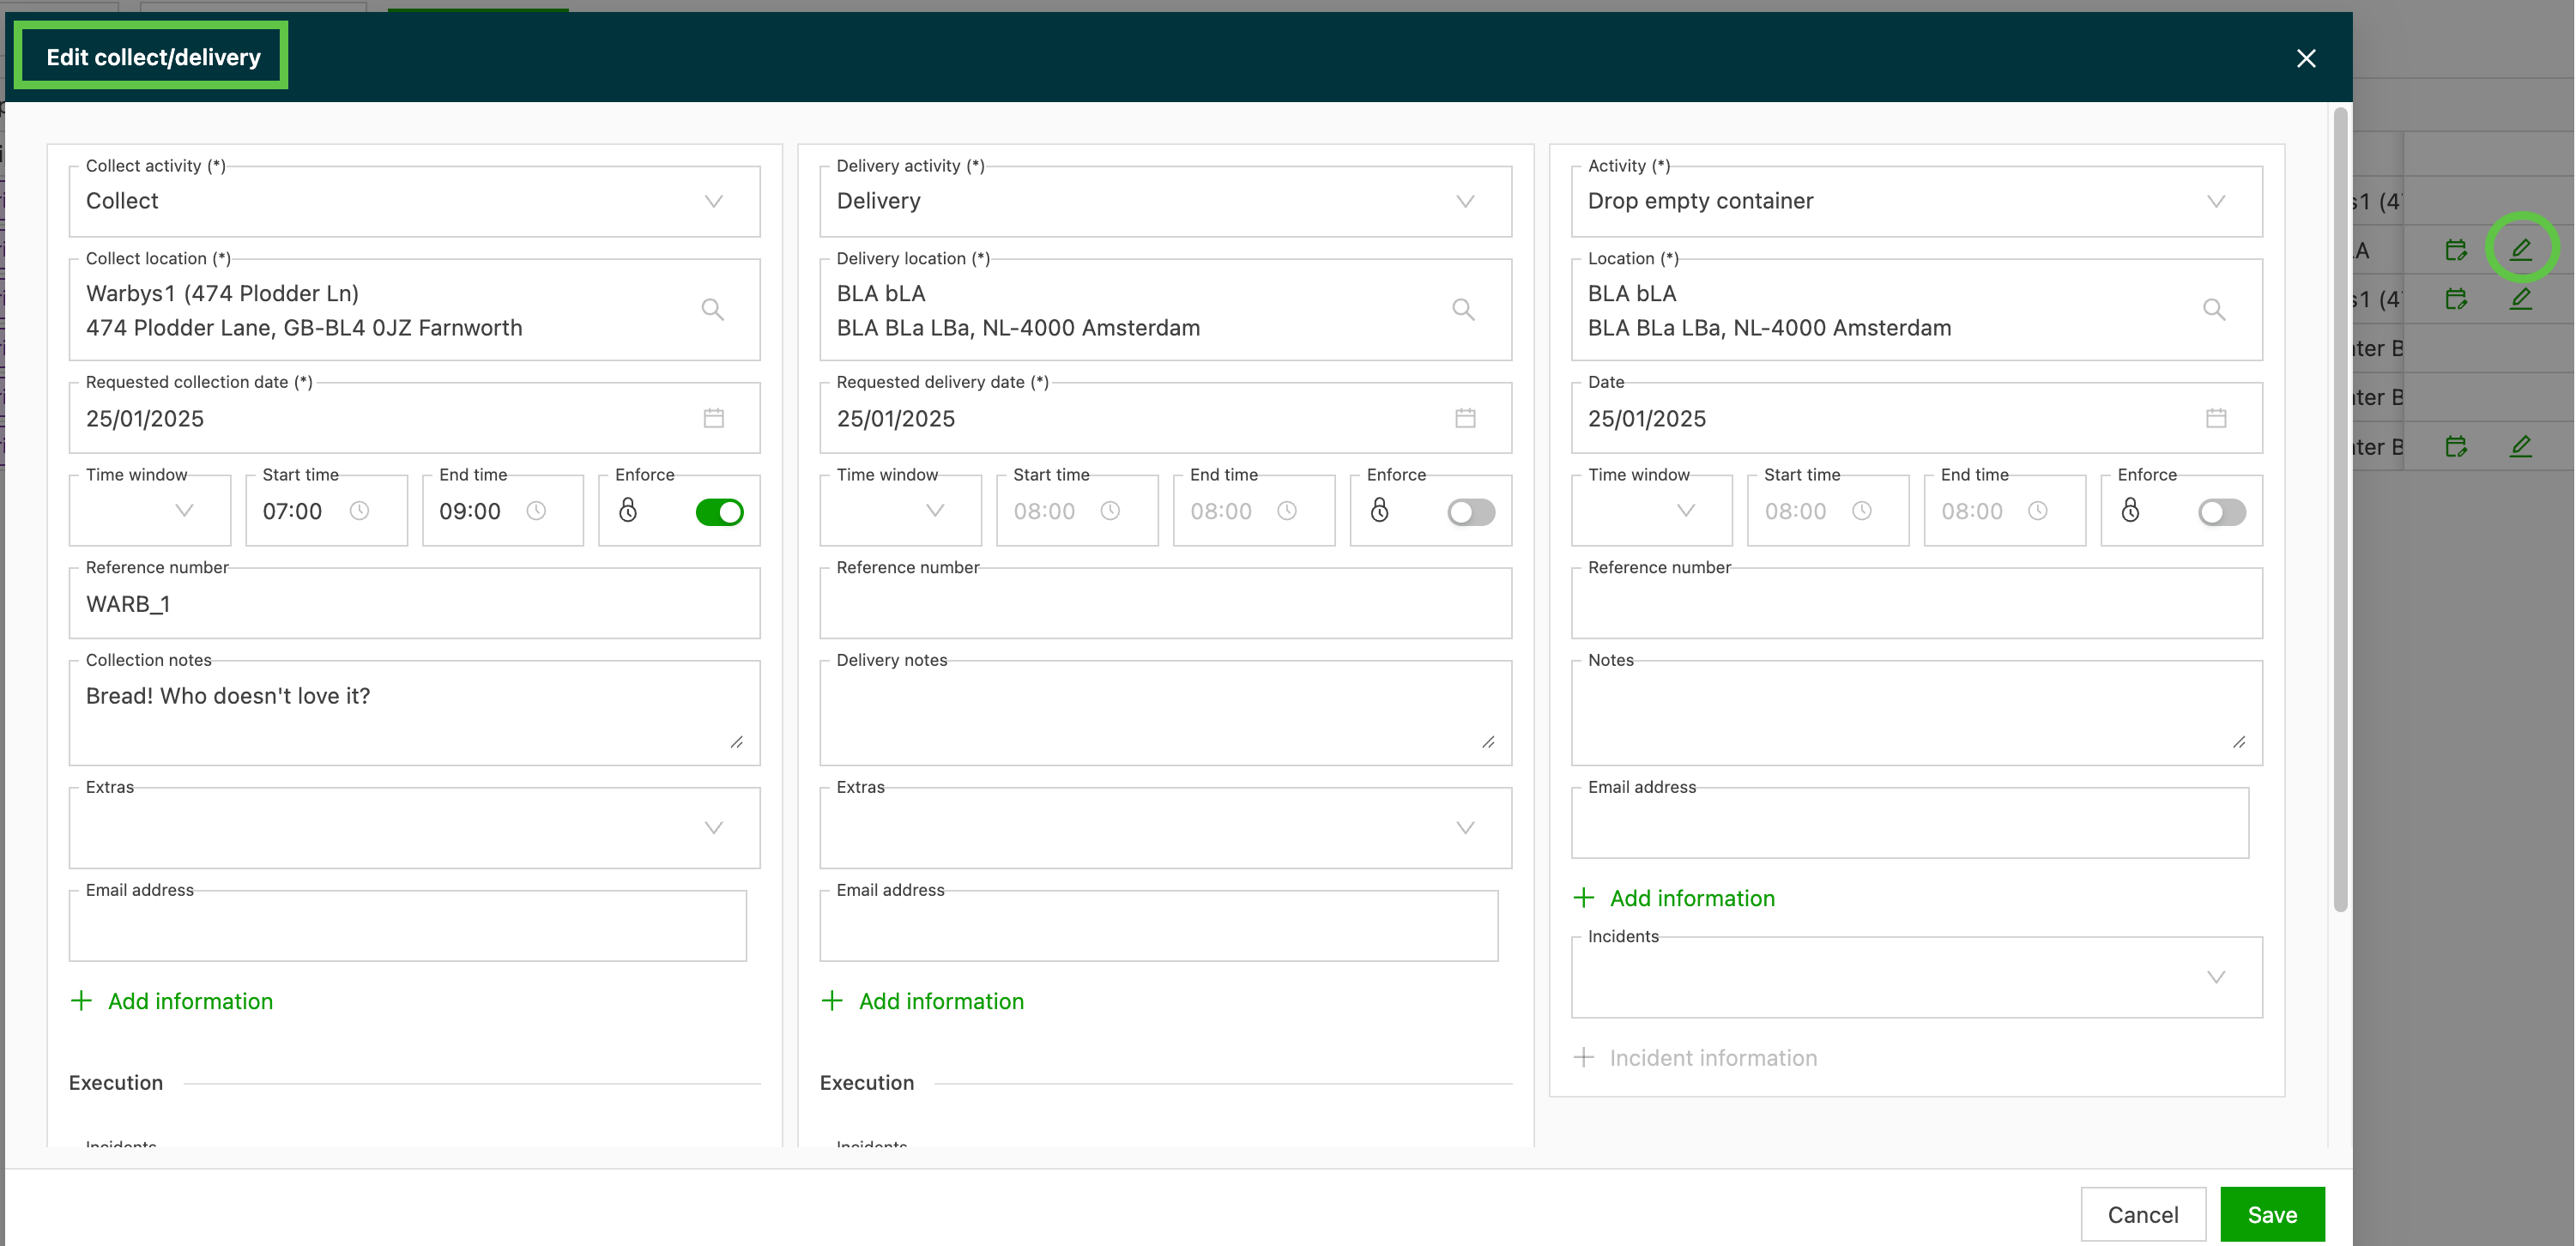
Pencil icon: Edit pickup/delivery panel. This allows the user to update any stops that are not yet completed.
Filter stops by activity
In addition to the existing pickup/delivery filter under Show stops, the Stops overview can be filtered by Activity. This narrows the list to one or more specific activity types: for example, terminal loads and unloads, an internal stop action such as Cleaning, or an intermodal terminal stop.
Activity groups
The Activity filter organizes activities into groups.
- Goods, Owned container/trailer, Import (delivery only), Export (pickup only), Split order: standard stop activities. For example, Terminal loading and unloading sit under Split order, and Pickup empty container and Drop container sit under Owned container/trailer.
- Intermodal: terminal stops, shown only for tenants with intermodal transport configured.
- Other: a fixed set of additional activities (non-owned container pickup/delivery, empty container pickup/drop).
- Stop types: the tenant’s own configured internal stop actions (e.g., Cleaning or Storage) and other configured stop types. This is tenant-specific and reflects what is configured under Locations > Internal stop actions.
- Incidents: the incident types configured for the tenant.
Walkthrough
-
Navigate to Stops.
-
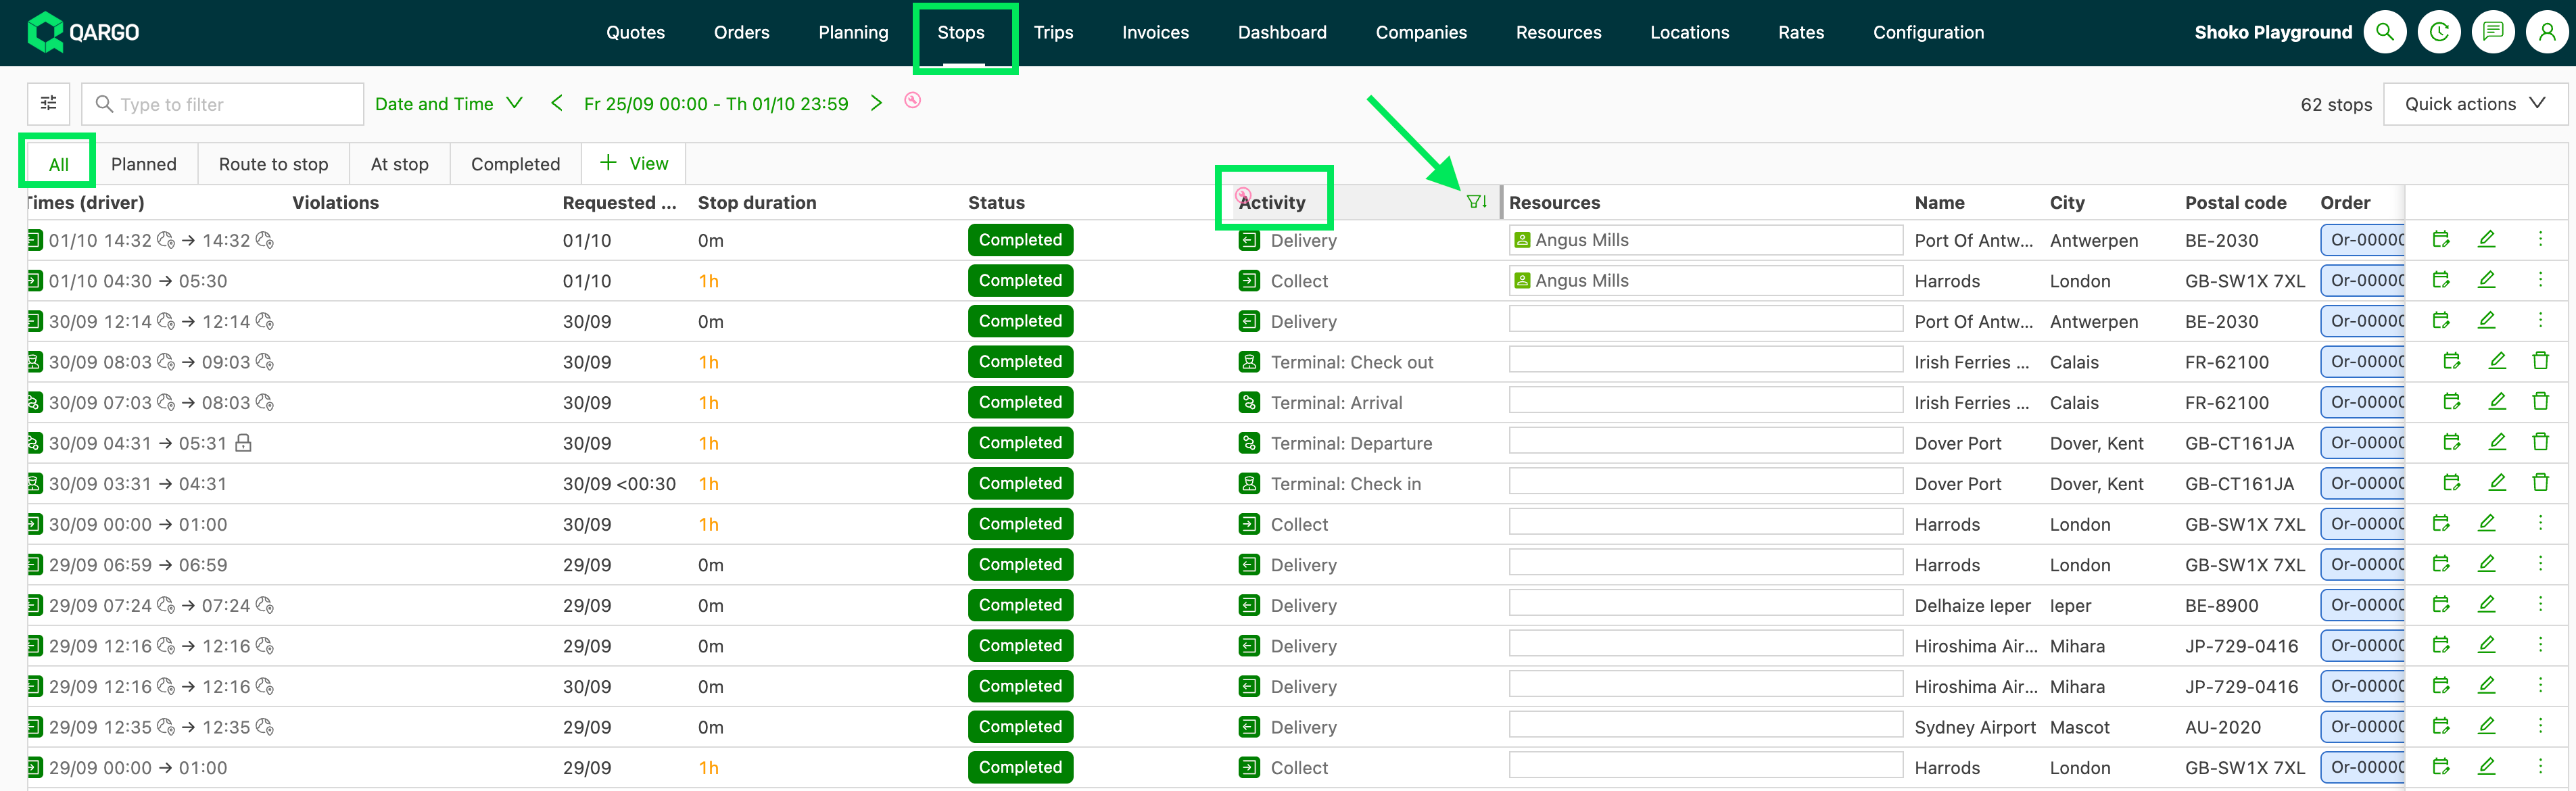
Locate the Activity column on the All view.
-
Click the filter icon.
-
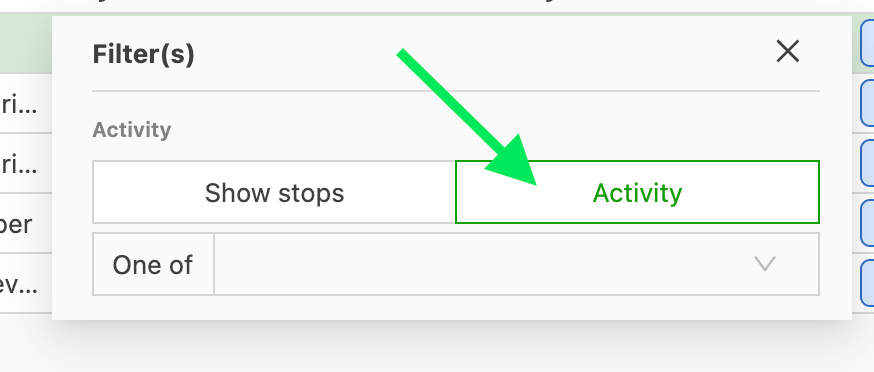
Switch the Activity from Show stops to Activity.
-
Select one or more groups from the dropdown list on the left side, or
use the free-text search to find one directly.
Note: Ticking a group automatically selects all activities in the group at once. -
Select the desired activities one by one.
- See also: Internal stop actions and Stop activity configuration for resources for how the Stop types group is configured.
Temperature columns
The Stops view can show requested set points, live readings and freight temperatures. Dispatchers following refrigerated loads can check a reefer from the Stops view without opening the Loads overview or each load. The columns are display-only.
Prerequisites
-
Super Admin: Activate Req SP zone 1 and Req SP zone 2 under Configuration > Additional fields > Loads.
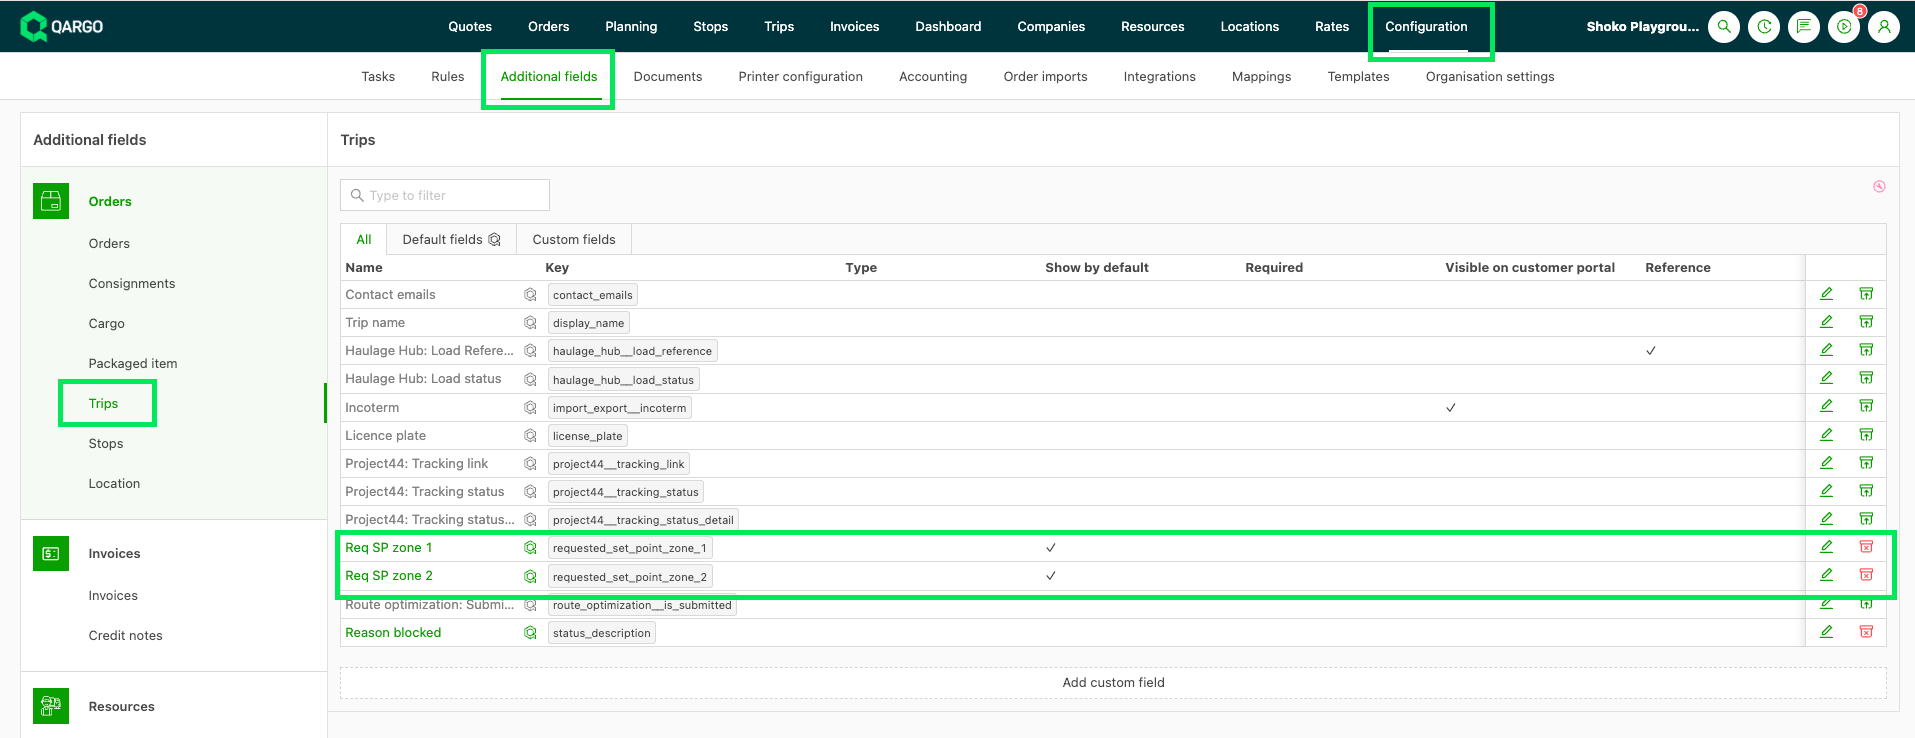
The Act temp zone 1 and Act temp zone 2 switches only appear once these fields are active.
-
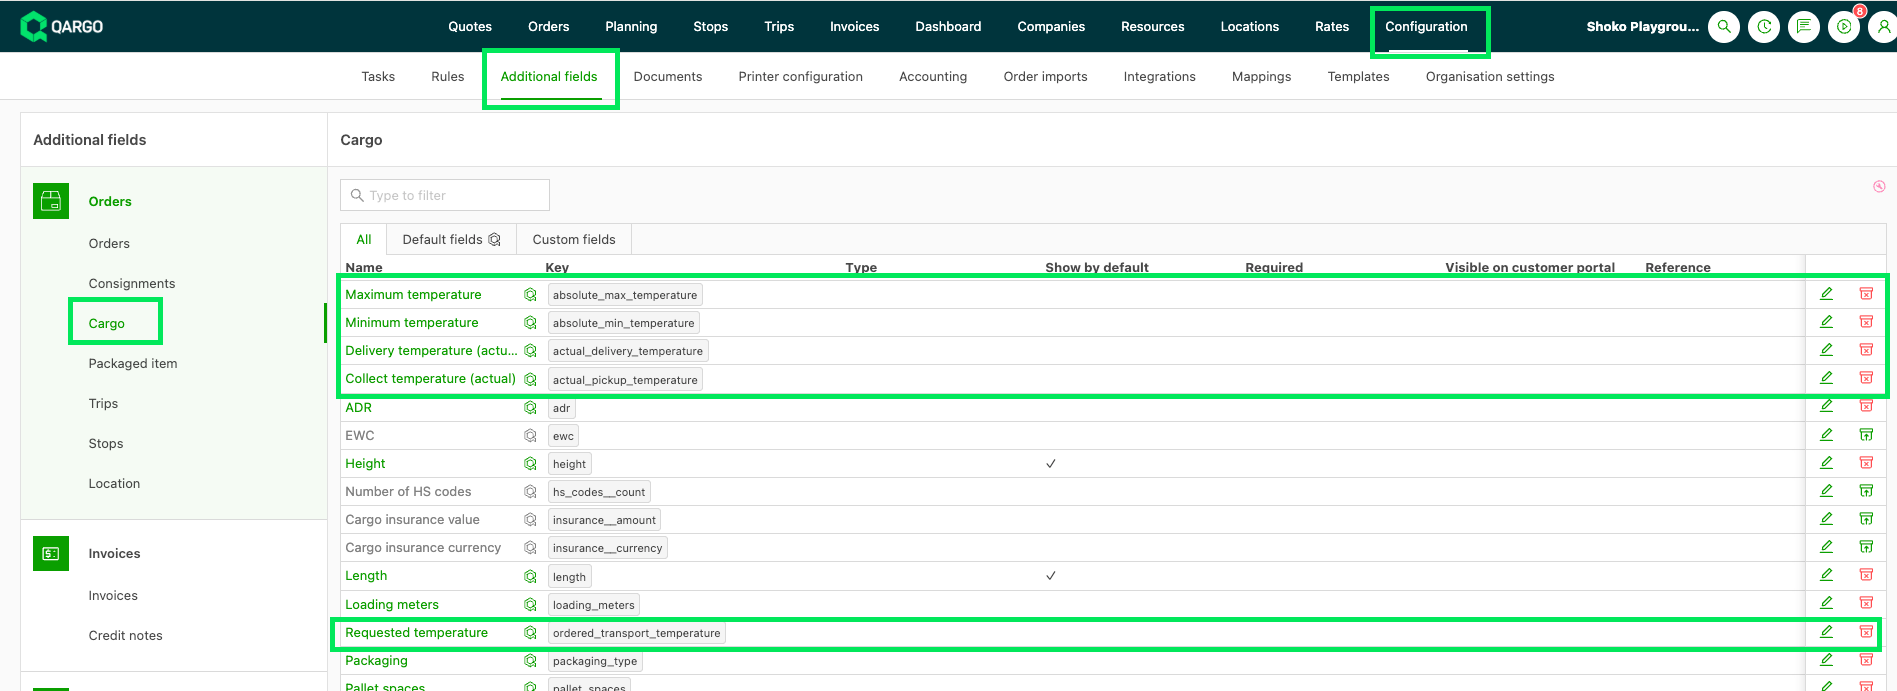
Super Admin: Activate the freight temperature fields under Configuration > Additional fields > Freight. Search for “temp” to find them.
Show the temperature columns
- Open Stops.
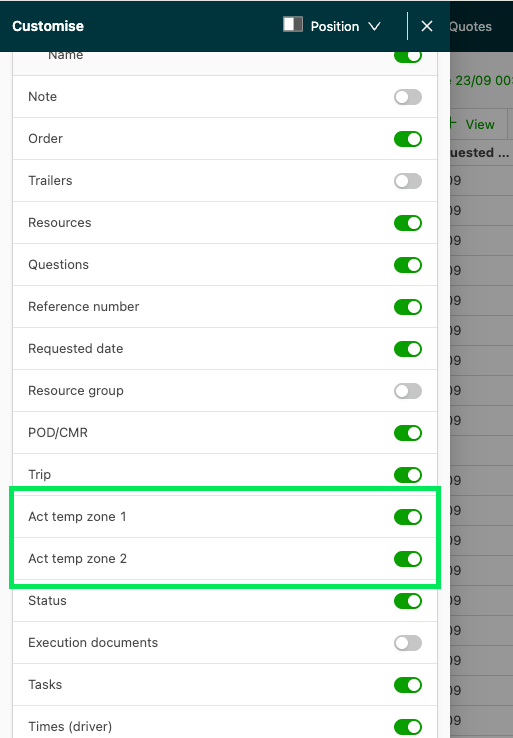
- Click Customize.
- Switch on Act temp zone 1 and Act temp zone 2. Both sit right after Load.
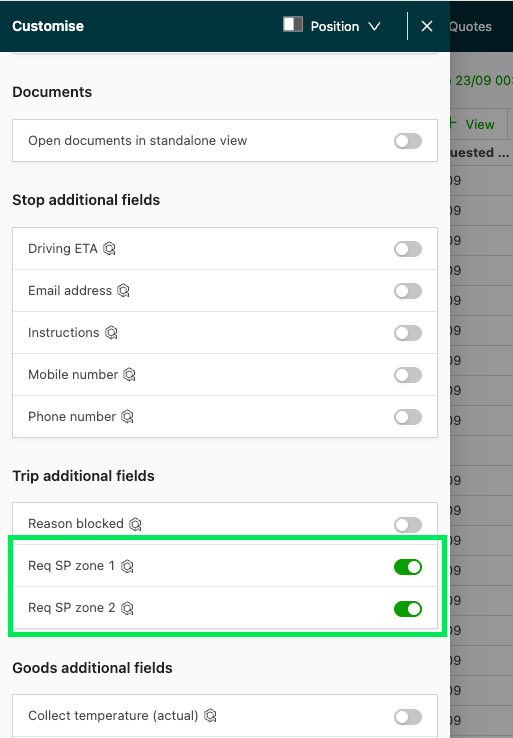
- Open the Load additional fields group.
- Switch on Req SP zone 1 and Req SP zone 2.
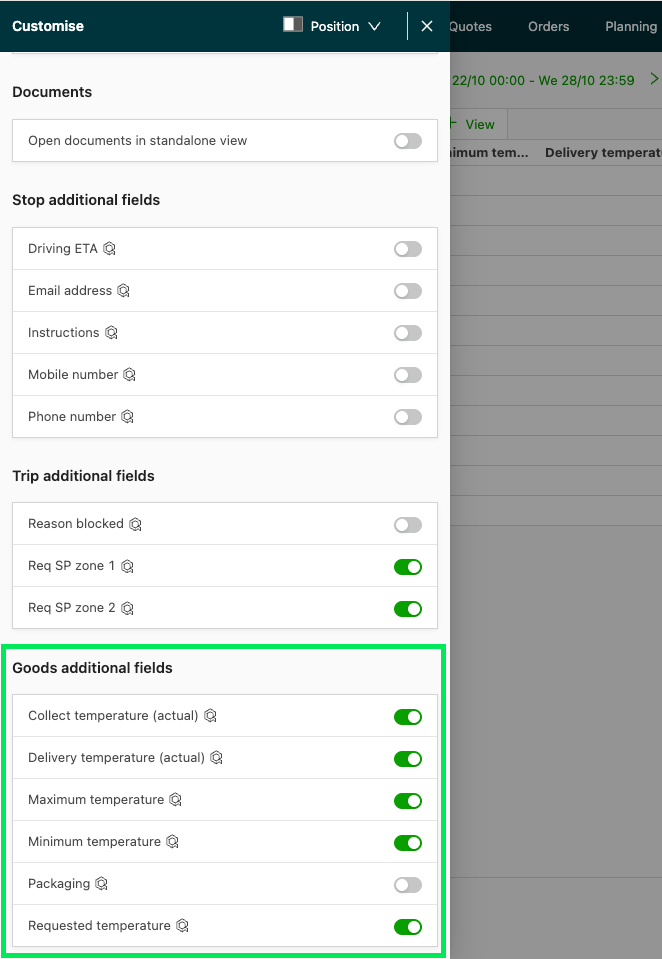
- Open the Goods additional fields group.
- Switch on the freight columns to display, such as Requested temperature or Delivery temperature (actual).
What the columns show
| Column | Shows | On completed stops |
|---|---|---|
| Req SP zone 1/2 | Requested set point of the load, repeated on every stop of that load | Still shown |
| Act temp zone 1/2 | The cooling unit’s actual set point and the measured temperature side by side, from telematics, as on the Loads overview. The cell is colored when the reading drifts from the set point | Empty |
| Requested temperature, Minimum temperature, Maximum temperature | Freight temperature entered on the order, one value per freight line handled at the stop | Still shown |
| Pickup temperature (actual), Delivery temperature (actual) | Temperature recorded for the freight at pickup and delivery, one value per freight line | Still shown |
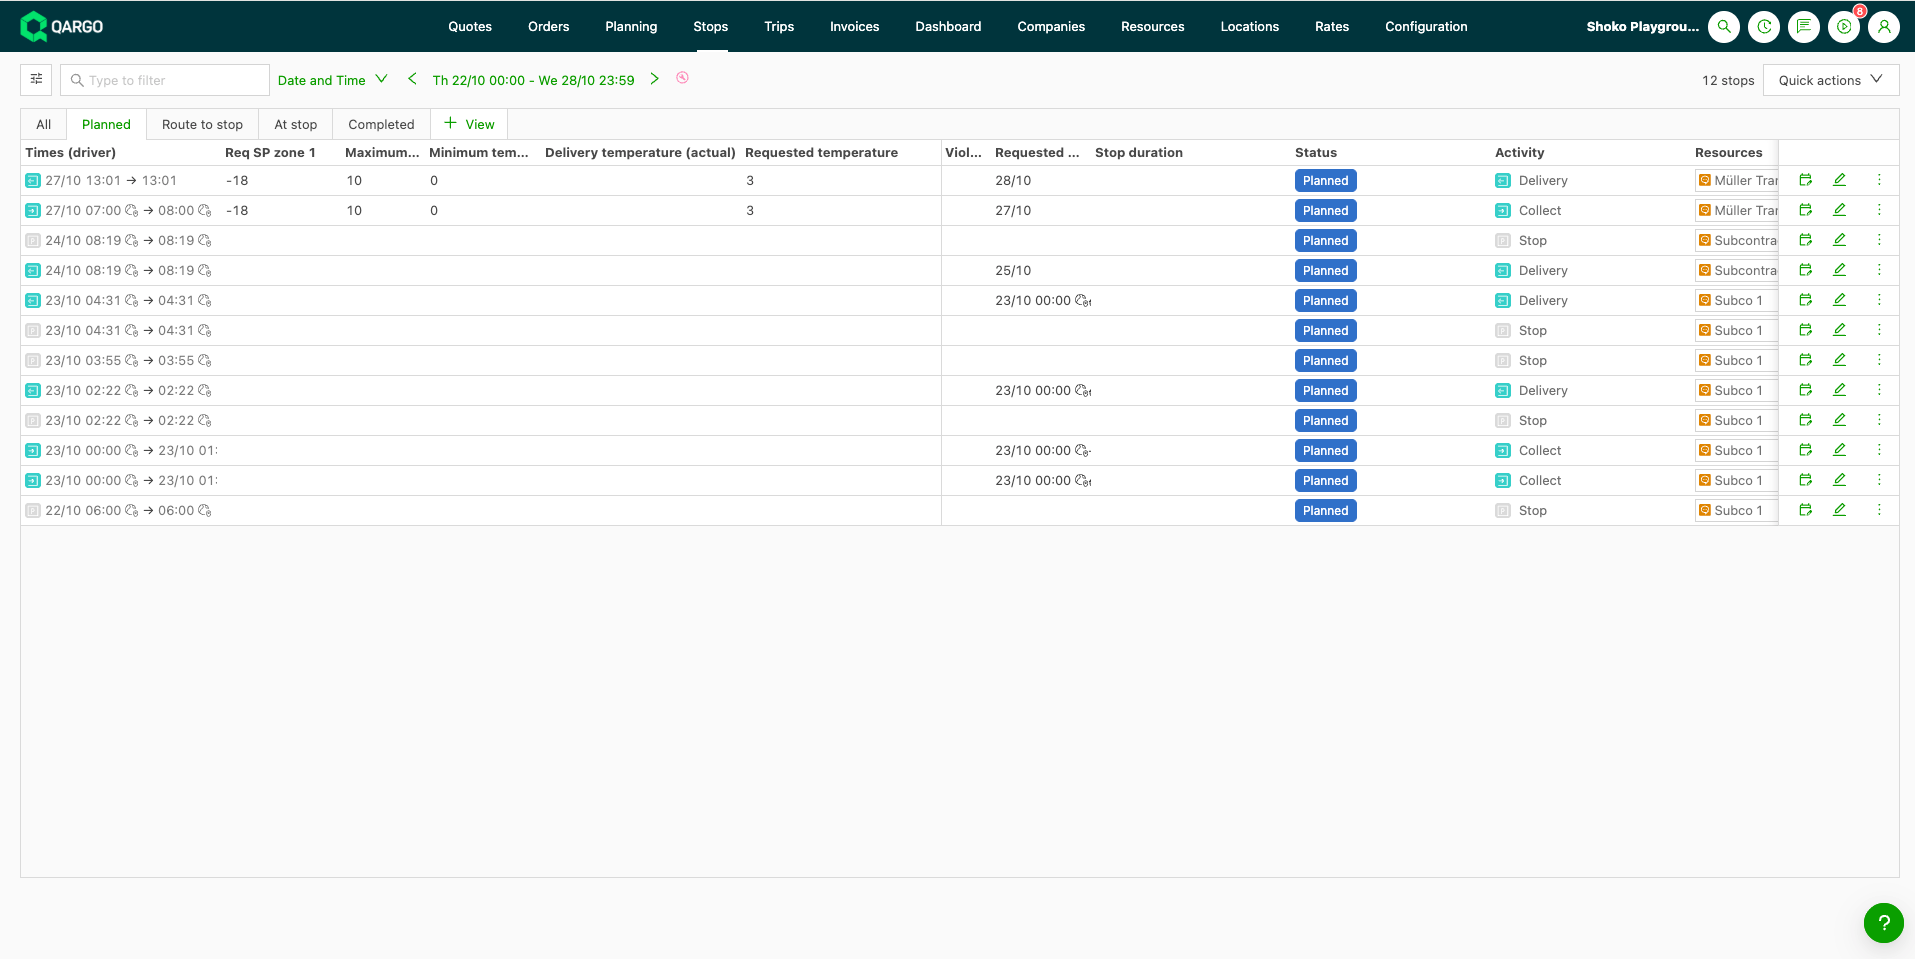
- The Load additional fields group also lists the tenant’s other load fields.
- Standalone stops without a shipment show no goods values.
FAQ
Q: Does anything need to be configured to use the Activity filter?
_A: No. Nothing needs to be set up beforehand to use it._
Q: Does this affect existing saved views on the Stops overview?
_A: No. Show stops remains the default mode and behaves exactly as before, so saved views are unaffected._
Q: Why are container pickups or empty drops not shown when filtering by ‘Goods > Pickup’ or ‘Goods > Delivery’?
_A: ‘Goods > Pickup’ and ‘Goods > Delivery’ return only real pickup/delivery stops. To also see container pickups or empty drops, select the relevant activities under Owned container/trailer as well. Activity makes it possible to combine groups in a single filter, which was not possible with Show stops._
Q: Why are the Act temp zone 1/2 switches missing in Customize?
A: The switches only appear when Req SP zone 1 and Req SP zone 2 are active under Configuration > Additional fields > Loads. A Super Admin can activate them.
Q: Why is Act temp zone 1/2 empty on a stop?
A: Either the stop is completed, or no telematics integration provides readings for the trailer. On completed stops, the cell stays empty because it would show the load’s current reading. Use the Pickup temperature (actual) or Delivery temperature (actual) goods columns for the reading at the stop.
Q: Can the temperature columns be filtered or sorted?
A: Not yet. They are display-only.