
Rate card: rate table calculation metrics
This article covers the calculation metric options that are available when configuring price lists based on a rate table.
Table of contents
Price list calculations can be set up based on a fixed amount, a formula or a rate table. Each calculation method has additional metrics that are used to calculate the final price.
This article looks at the options available when using the calculation ‘Rate table’ as the basis of the customer price list. Rate table calculations give the widest possible configuration. However, this also brings the most complexity and requires careful setup. A wide variety of options are available when using a rate table; this article covers the most frequently used options.
Create calculation metric and result of rate table.
Select the calculation method ‘Rate table’. This opens the next set of metrics to select, based on how the rate table results should show. Options include:
- Fixed amount
- Fixed per package type/product
- Fixed per stop
- Multiplied by a metric
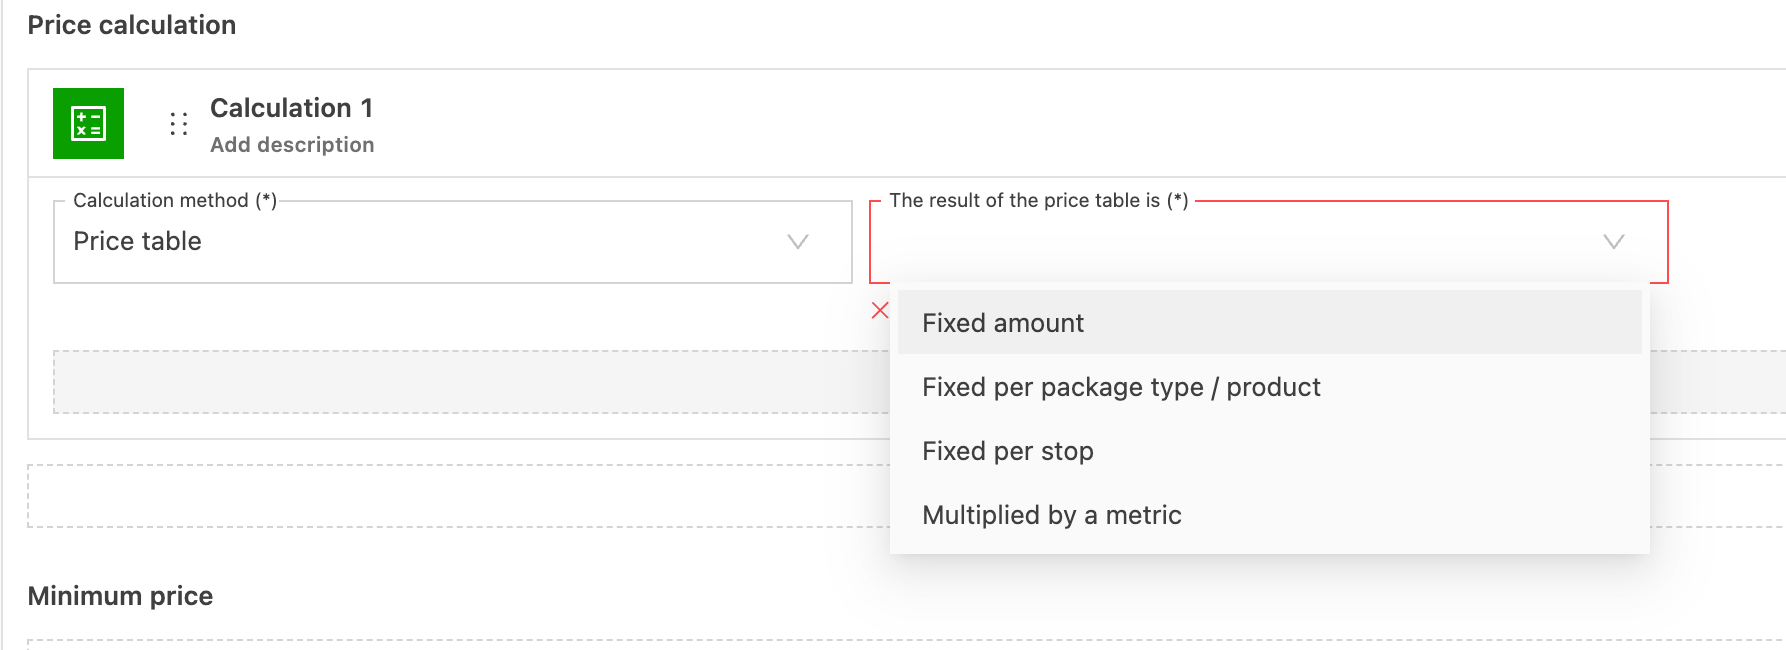
Once the ‘Results’ metric is added, the next option shows. For Fixed amount, Fixed per package type and Fixed per stop, the option is ‘Edit rate table’.

When ‘Multiplied by a metric’ is selected, another ‘metric’ field appears where additional metrics can be selected. Each metric has an additional tiered level, with options similar to those available when creating a Formula price list.
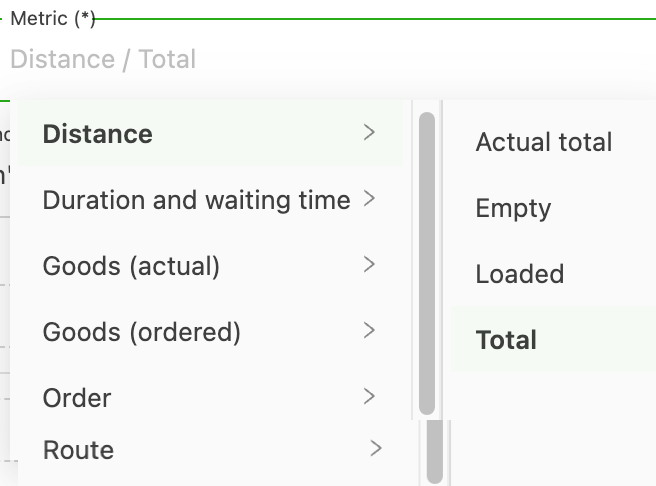
Once the metric is selected, the option ‘Edit rate table’ appears, along with the additional metrics that are used to create the final price. When a rate table is multiplied by a metric, the metric value is multiplied by the rate from the rate table. For example, if a weight-based rate table places 150 kg in a bracket costing €1.5/kg, the calculation is 150 × €1.5 = €225.
There are also special calculation modes to handle edge cases near bracket boundaries:
-
Payant pour: Takes the minimum between the normal calculation and the minimum of the next bracket. For example, with 150 kg at €1.5/kg (€225), if the next bracket starts at 200 kg at €1/kg (€200), it uses €200 as the final price
-
Pour en paye: Takes the maximum between the normal calculation and the maximum of the previous bracket. Using the same example, if the previous bracket was 0–99 kg at €3/kg, it compares €225 with 99 kg × €3 = €297, and uses €297
-
Click here to learn more about Payant pour / Pour en paye.
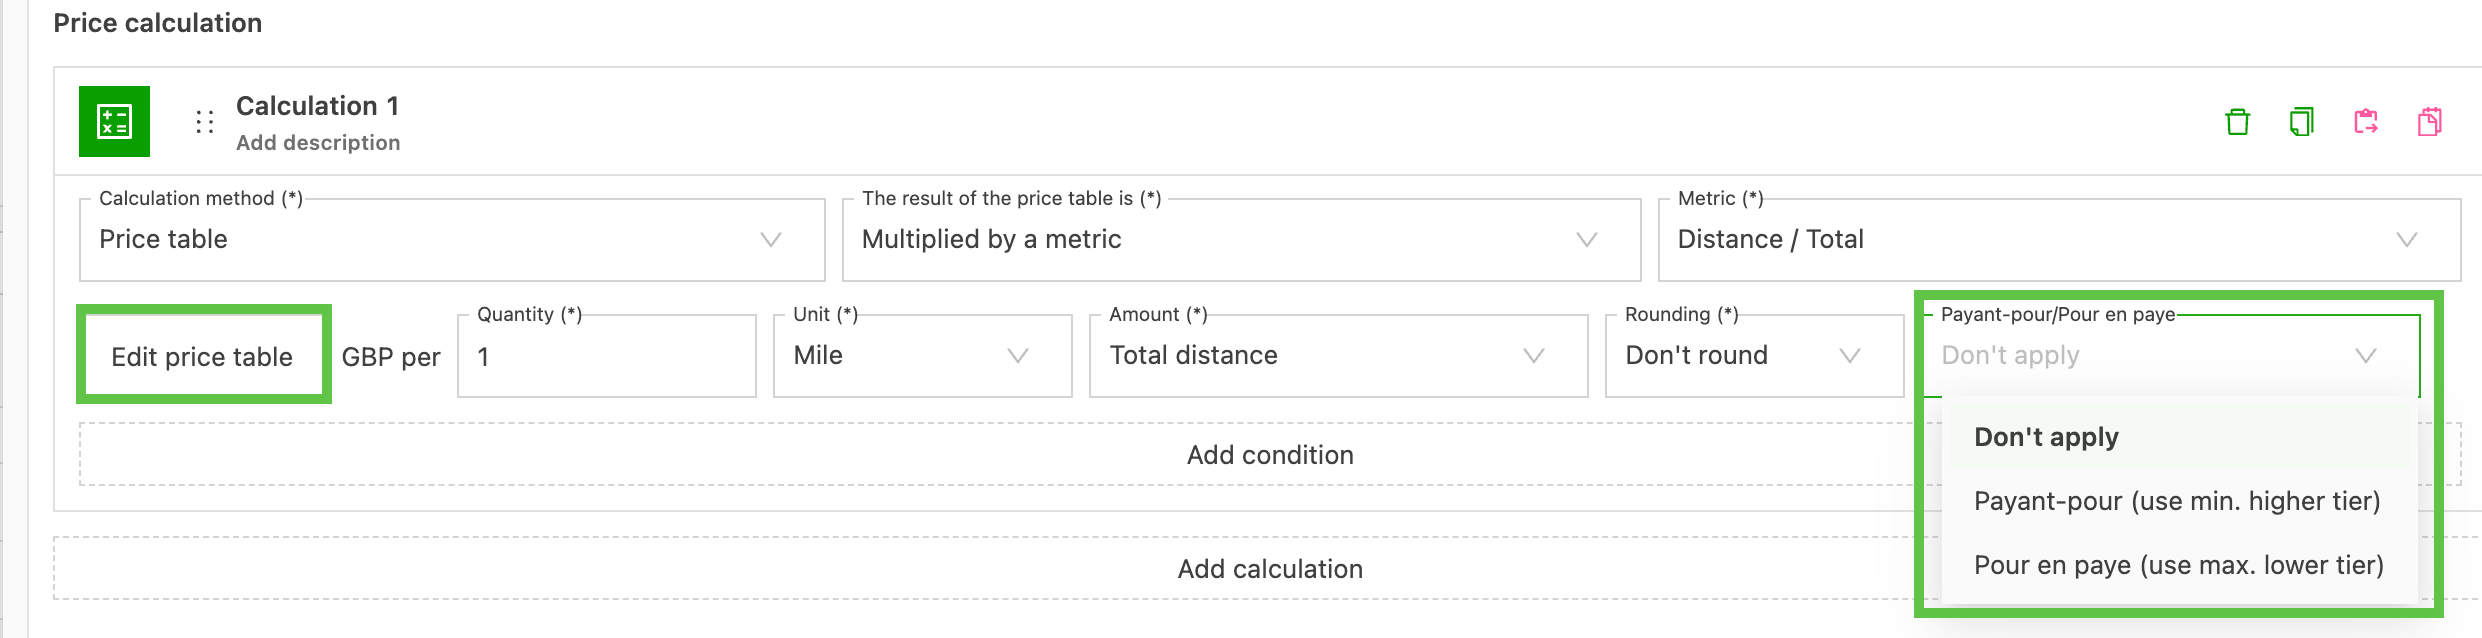
These calculation modes help prevent undercharging or overcharging for values near the beginning or end of each range.
Add table metrics
To configure the rate table, click ‘Edit rate table’ to create the table that is used as the basis for the calculations. The ‘Rates’ page shows options to create metrics for 3 columns (Column 1, Column 2, Column 3). There are 2 tabs: Metrics and Rates.
-
Metrics: Columns configured in the ‘Column 1, 2, 3’ fields are displayed here. Each ‘column’ has drop-down menus that work on a tiered basis. Once the first option is selected, the next drop-down menu appears, with options that relate to the previous selection. Add the metrics according to what the price is based on, e.g.
- delivery location
- number of pallets
This creates the first column and first row of the Excel spreadsheet.
-
Rates: Once the Metrics table is created, the table is copied to the Rates tab with the option to add the price for each line item.
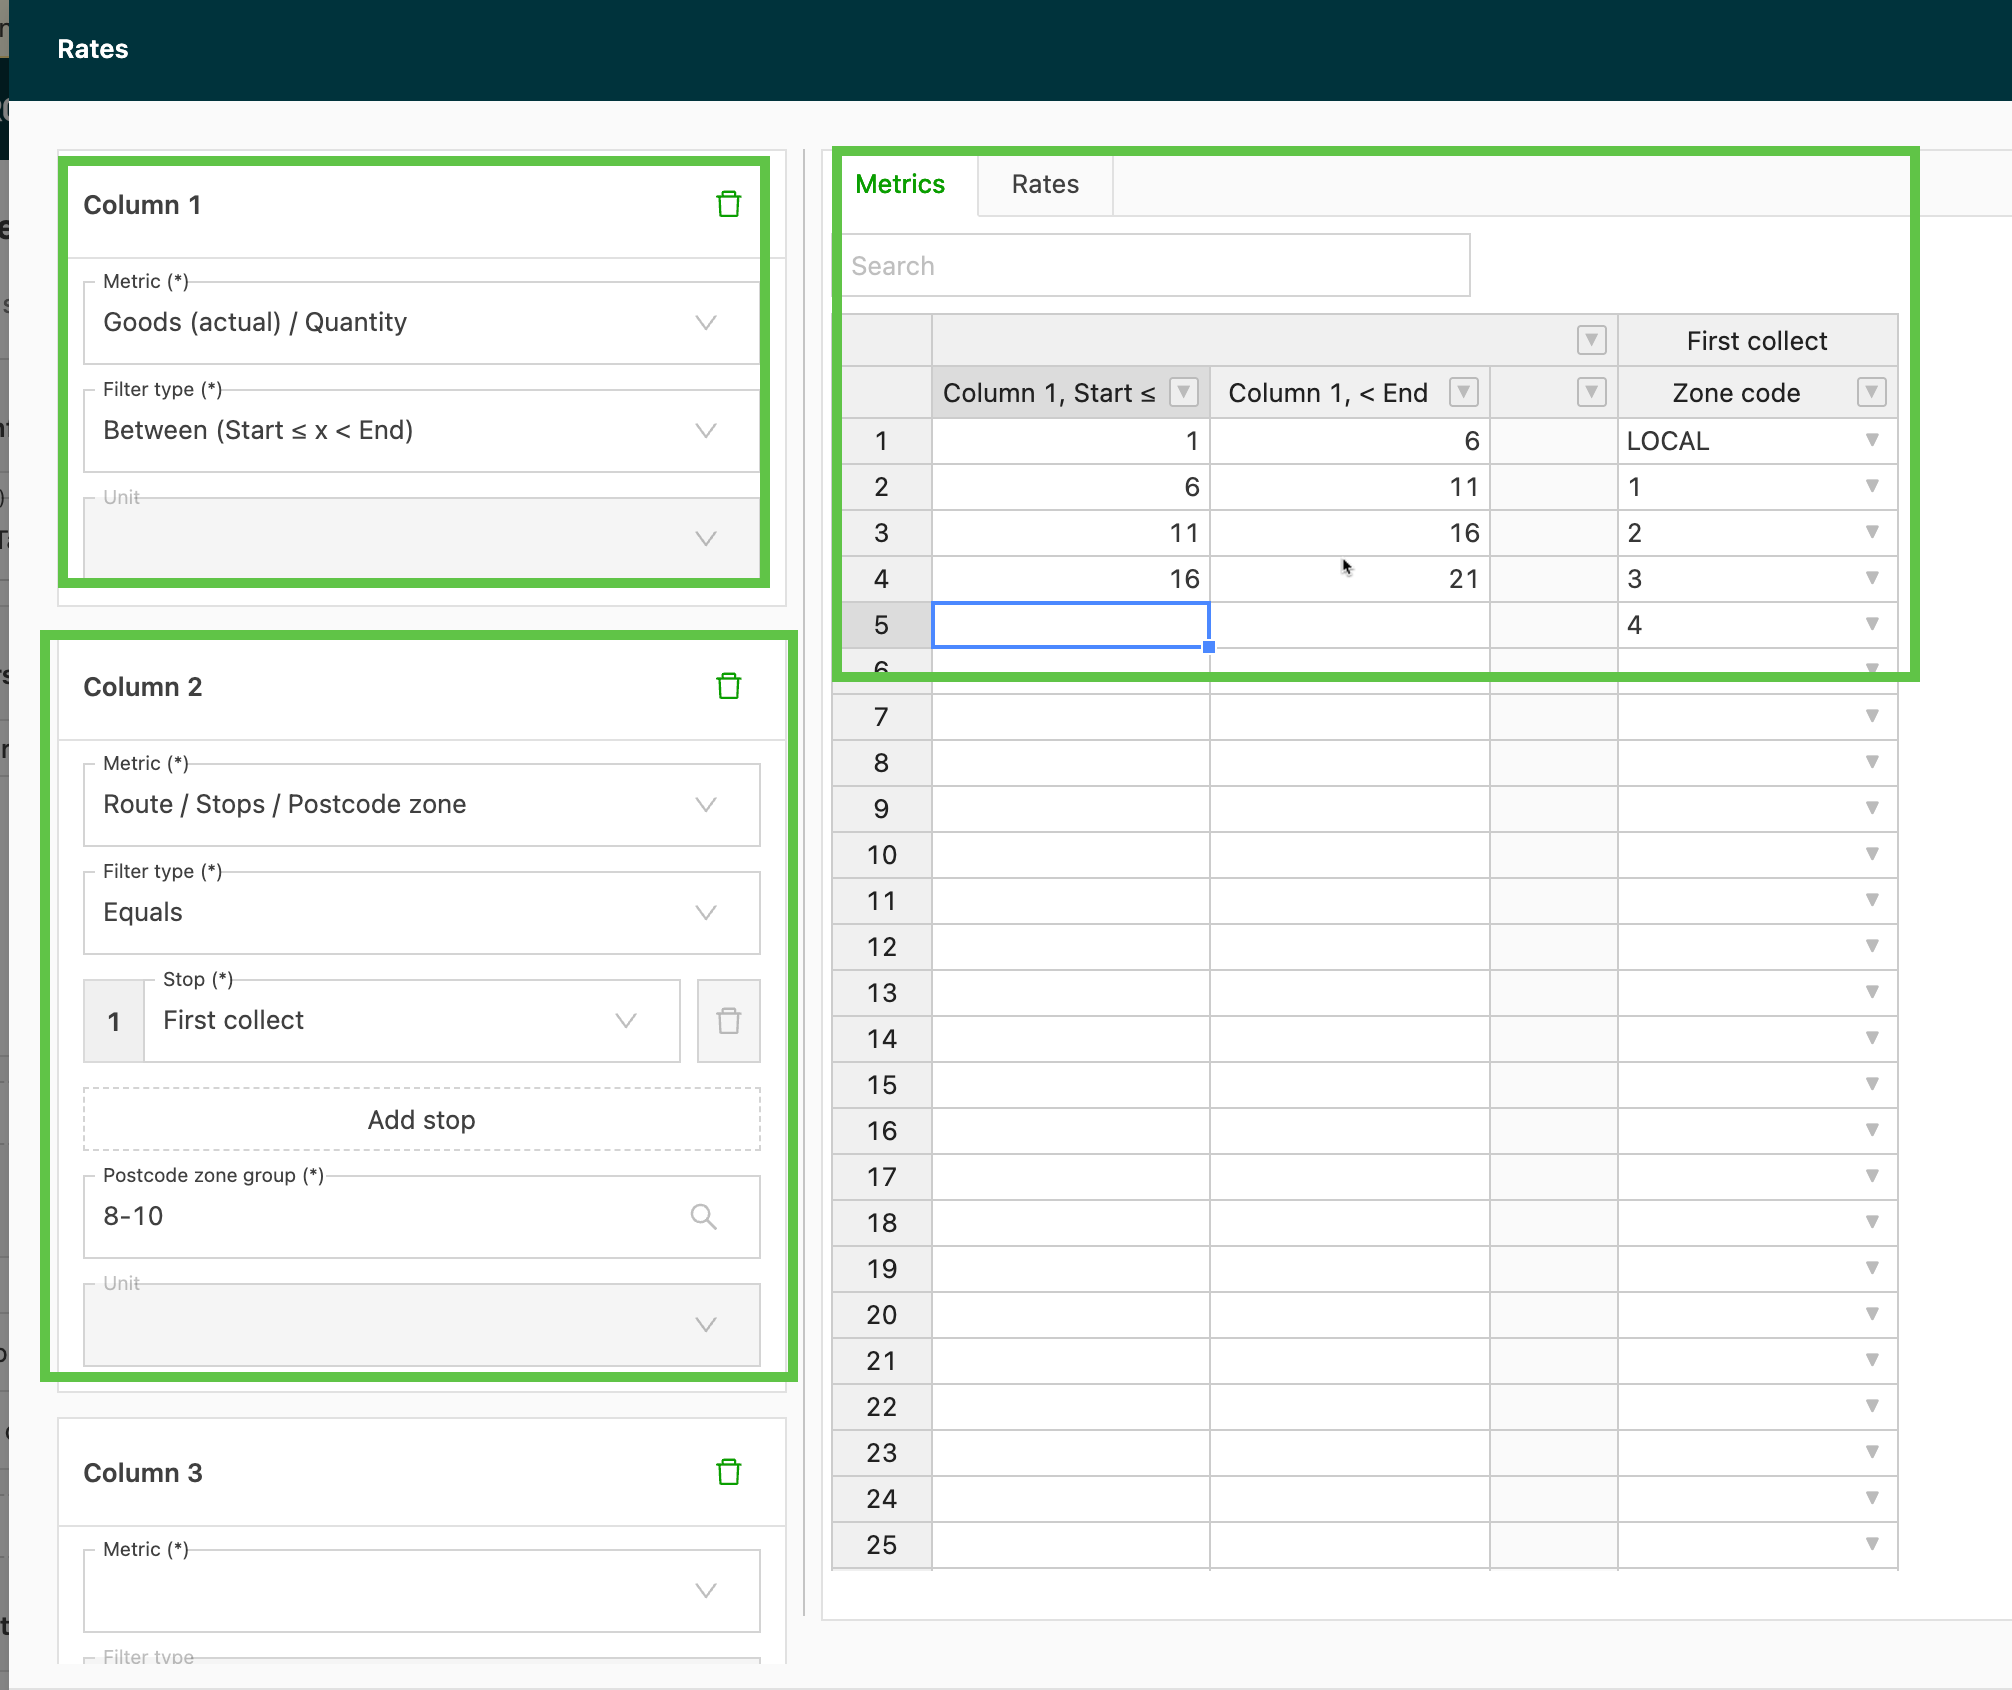
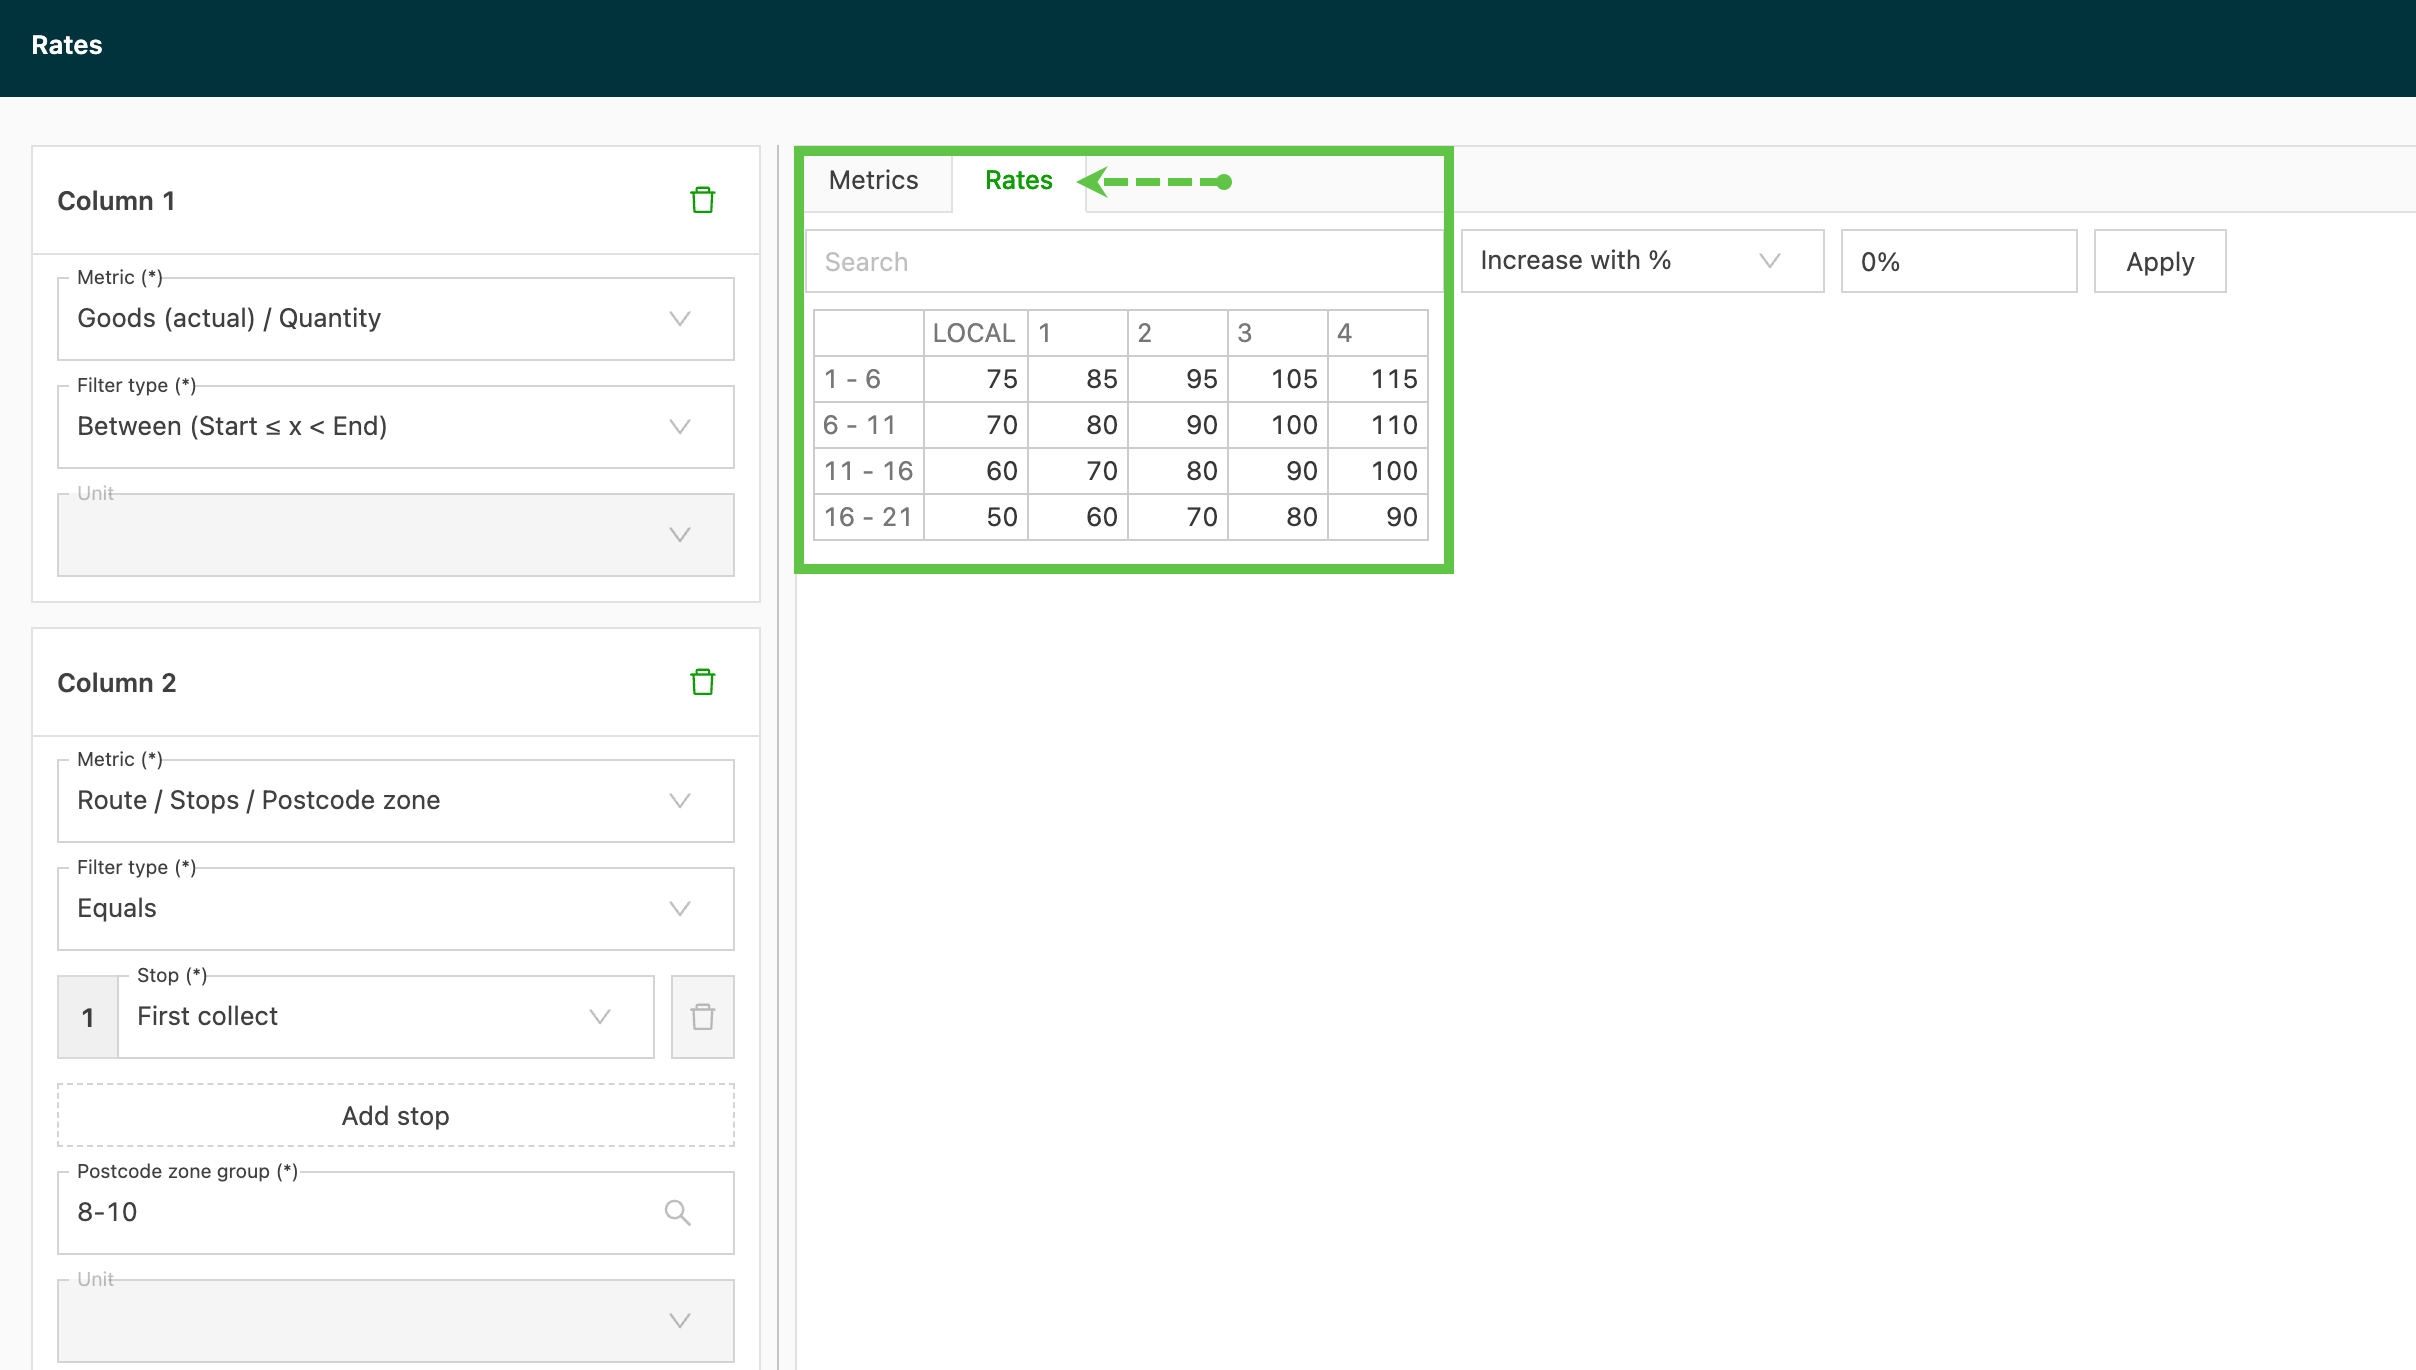
Table metrics are extremely flexible to accommodate a variety of price configuration requirements. The metric options work on the same tiered basis found throughout the configuration: selecting the first metric reveals additional options.
-
Distance / Duration and wait time / Goods (actual) / Goods (ordered) are the same as those used in the Formula price configuration.
-
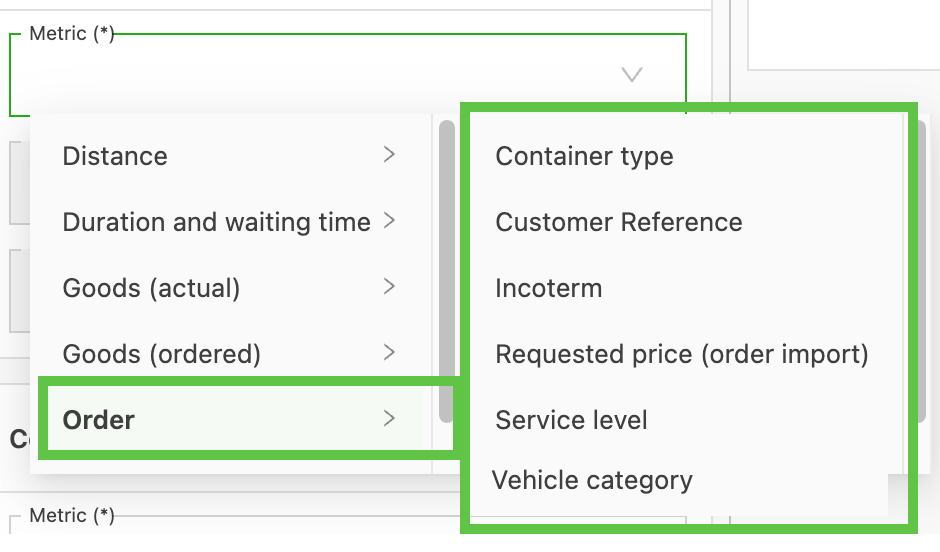
Order:
-
Container type: Available options are pulled from the configured container type options. These show in the column drop-down for selection, and the calculation looks at the container type on the order. This calculation works with both ‘Owned containers’ and ‘Sea containers’ transportation services. Metrics can be set for first pickup and last drop containers. However, the system does not distinguish between loaded and empty containers when calculating prices.
-
Customer reference: Customer references can be used as both a condition and a metric, allowing configuration of different prices based on specific customer references. This is useful for large companies that may have different rating for the same lane or service, based on timing or quantity.
- Note: ‘greater than/less’ options may not work properly, and these price lists should be carefully configured to avoid errors.
-
Incoterm: Rating based on the specified Incoterm allows a premium to be applied if certain responsibilities are assumed.
-
Requested price (order import): The requested price indicates how much the customer is willing to pay for a transport order. This is typically set up as part of an integration that supports sending orders with an agreed set price.
-
Service level: Based on the service level (Next Day, 48hr, etc.) defined on the order, rate table calculations look for exact service level values rather than a range. This can help create rate tables based on service levels, combined with additional values (zones, weight, etc.).
-
Vehicle category: The vehicle category used in price calculations is based on what is entered at the order level. It does not automatically use the planned resource vehicle category.
-
-
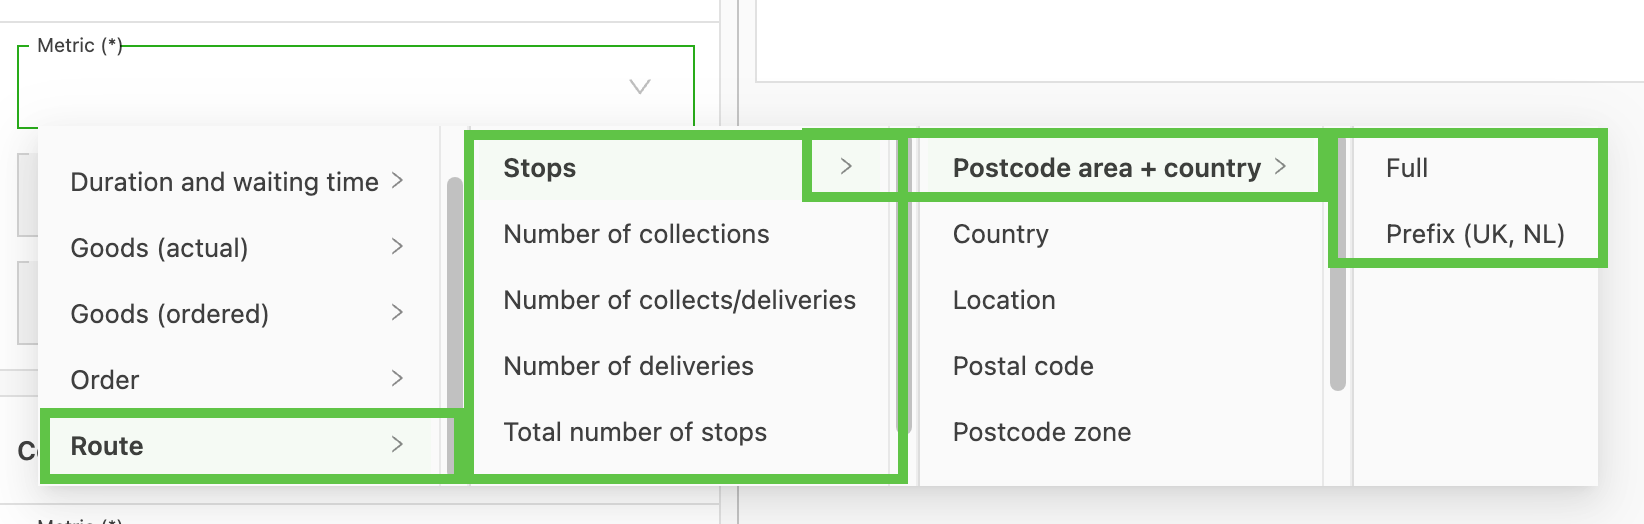
Route:
-
Stops: This reveals additional tier options:
-
ZIP code area + country:
- Full: Requires the full ZIP code
- Prefix (UK, NL): Only looks at the prefix of the ZIP code.
-
Country: Uses country codes for specific routes and looks at the country of the stops on the order.
-
Postal code: Looks at specific ZIP codes. The more specific the ZIP code, the better the precision, i.e., AB1 2EF is more precise than AB1.
-
ZIP code zone: Configured in ‘Zone groups’ and can be used to group ZIP codes into specific groups.
- Note: When using multiple calculations on the same rate card, disable the ‘Show error if metric is missing’ toggle. This allows the system to check subsequent calculations if the first one doesn’t match.
-
Requested weekday: This is useful for setting up rating based on specific days and is commonly used for surcharges. When used alongside a service level metric, the service level metric can determine the base price, and the weekday can automatically apply an extra fee if the requested day is a Saturday or Sunday.
-
-
Number of pickups: Counts the number of pickup stops only.
-
Number of pickups/deliveries: Counts the number of pickup / delivery stops only and allows rating to be based on the number of stops.
-
Number of deliveries: Counts the number of delivery stops only.
-
Total number of stops: Counts the total number of stops and allows rating to be based on the number of stops.
-
Total toll cost: The amount to charge can be set as a percentage of the toll cost; the default is 100%
- Note: Toll costs are provided through a third-party service and should be considered an estimate rather than exact amounts. Toll rates may change periodically; the system relies on the service keeping its data up to date.
-
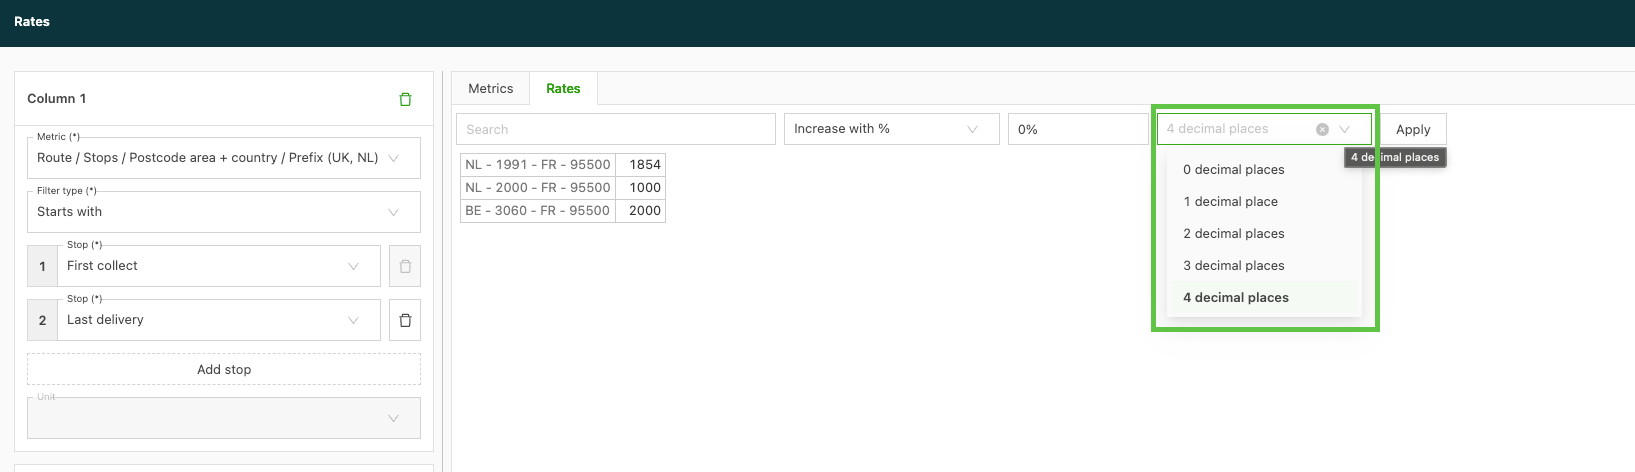
Once rates have been entered, prices can be easily increased or decreased using the drop-down options in the Rates tab. The default is set to 4 decimal places, but this can be adjusted down to 0, as preferred.
*See the Rate Card FAQs for some of the most frequently used types of rate table rate cards. These documents include short video overviews of how these are configured.*
⚠️ Custom fields cannot be used as conditions or metrics in rate card calculations. Only the standard system fields listed above are supported. If the rating logic depends on a custom field value, this cannot currently be configured in a rate card and needs to be raised as a feature request.
How metrics rows build the rates table
The Metrics tab tells the Rates tab how to build the rate table.
Each column in the Metrics tab (Column 1, Column 2, and Column 3) represents a different part of the rating. The rows entered under each column are the available values for that part.
The Rates table uses these values to create the price combinations:
- Column 1 values appear as the row labels in the Rates table.
- Column 2 values appear as the column headers.
- Column 3 values, if used, appear as additional column headers.