
Export to Excel in Dashboard
Dashboard displays data visualizations via graphs/tables. Export options: click the 3-dot menu, select CSV for raw data or image for a static copy.
Table of contents
The Dashboard shows a visualization of the data.
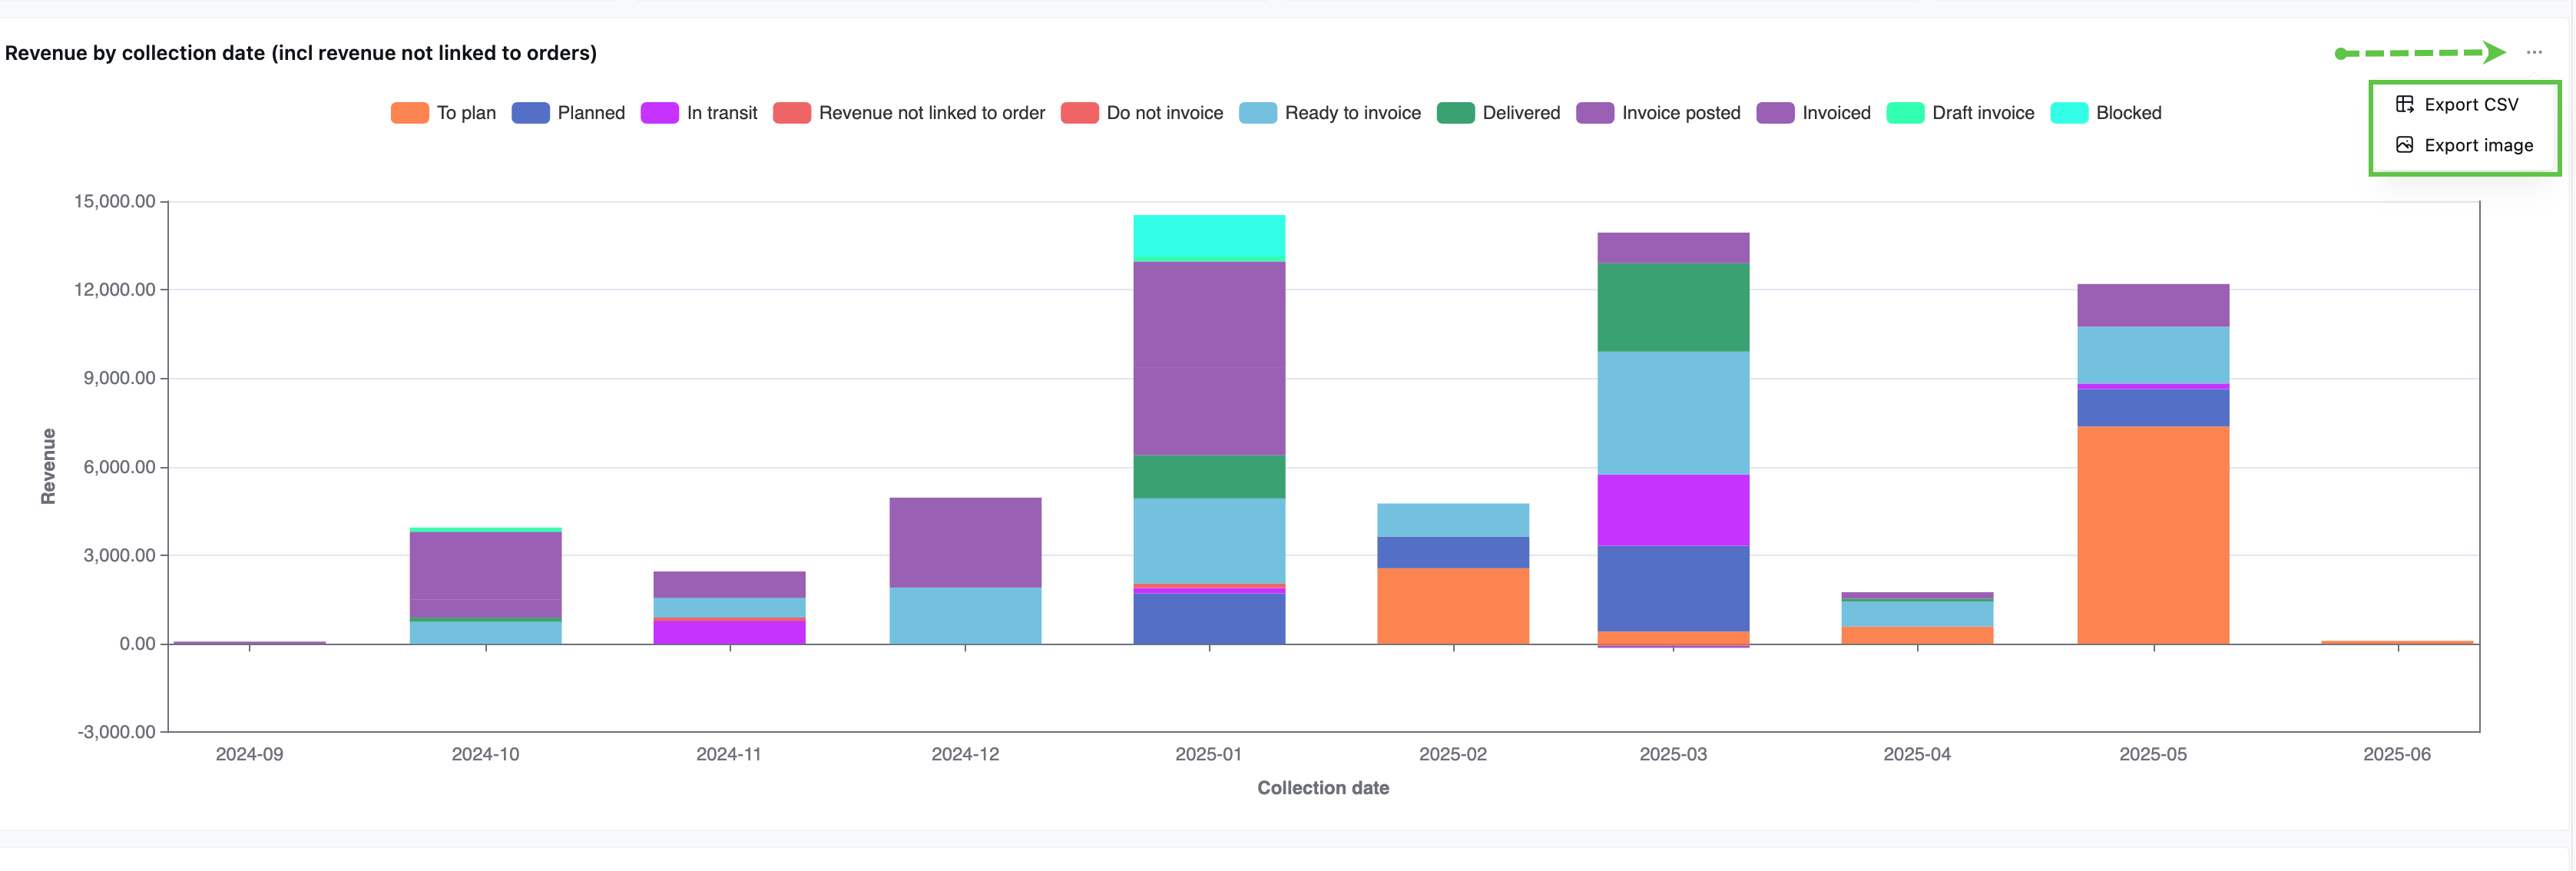
Each dashboard tab generates a number of graphs and tables to visualize the data. The data can be exported in .csv format, or the image can be exported alone.
To export:
-
Click the menu (3 dots) in the top right corner of the table / graph
-
Click ‘Export to CSV’ to export raw data in CSV file format
-
Click ‘Export image’ to export a copy of the image file only
- Note: exporting the graph produces an image only, with no interactive features
Convert file format
The exported file should be pre-formatted for Excel, in columns and rows. If the downloaded file format doesn’t look correct, try these formatting tips:
-
Use Text Import Wizard:
- Open Excel first (don’t double-click the CSV)
- Go to File > Open > Browse
- Select the CSV file
- In the Text Import Wizard, choose “Delimited”
- Try different delimiters (comma, semicolon, tab) until the preview looks correct
- Click Finish
-
Use Data > From Text/CSV:
- Open Excel
- Go to Data > Get Data > From File > From Text/CSV
- Select the file
- Excel shows a preview; change the delimiter in the dropdown if needed
- Click Load when the preview looks right