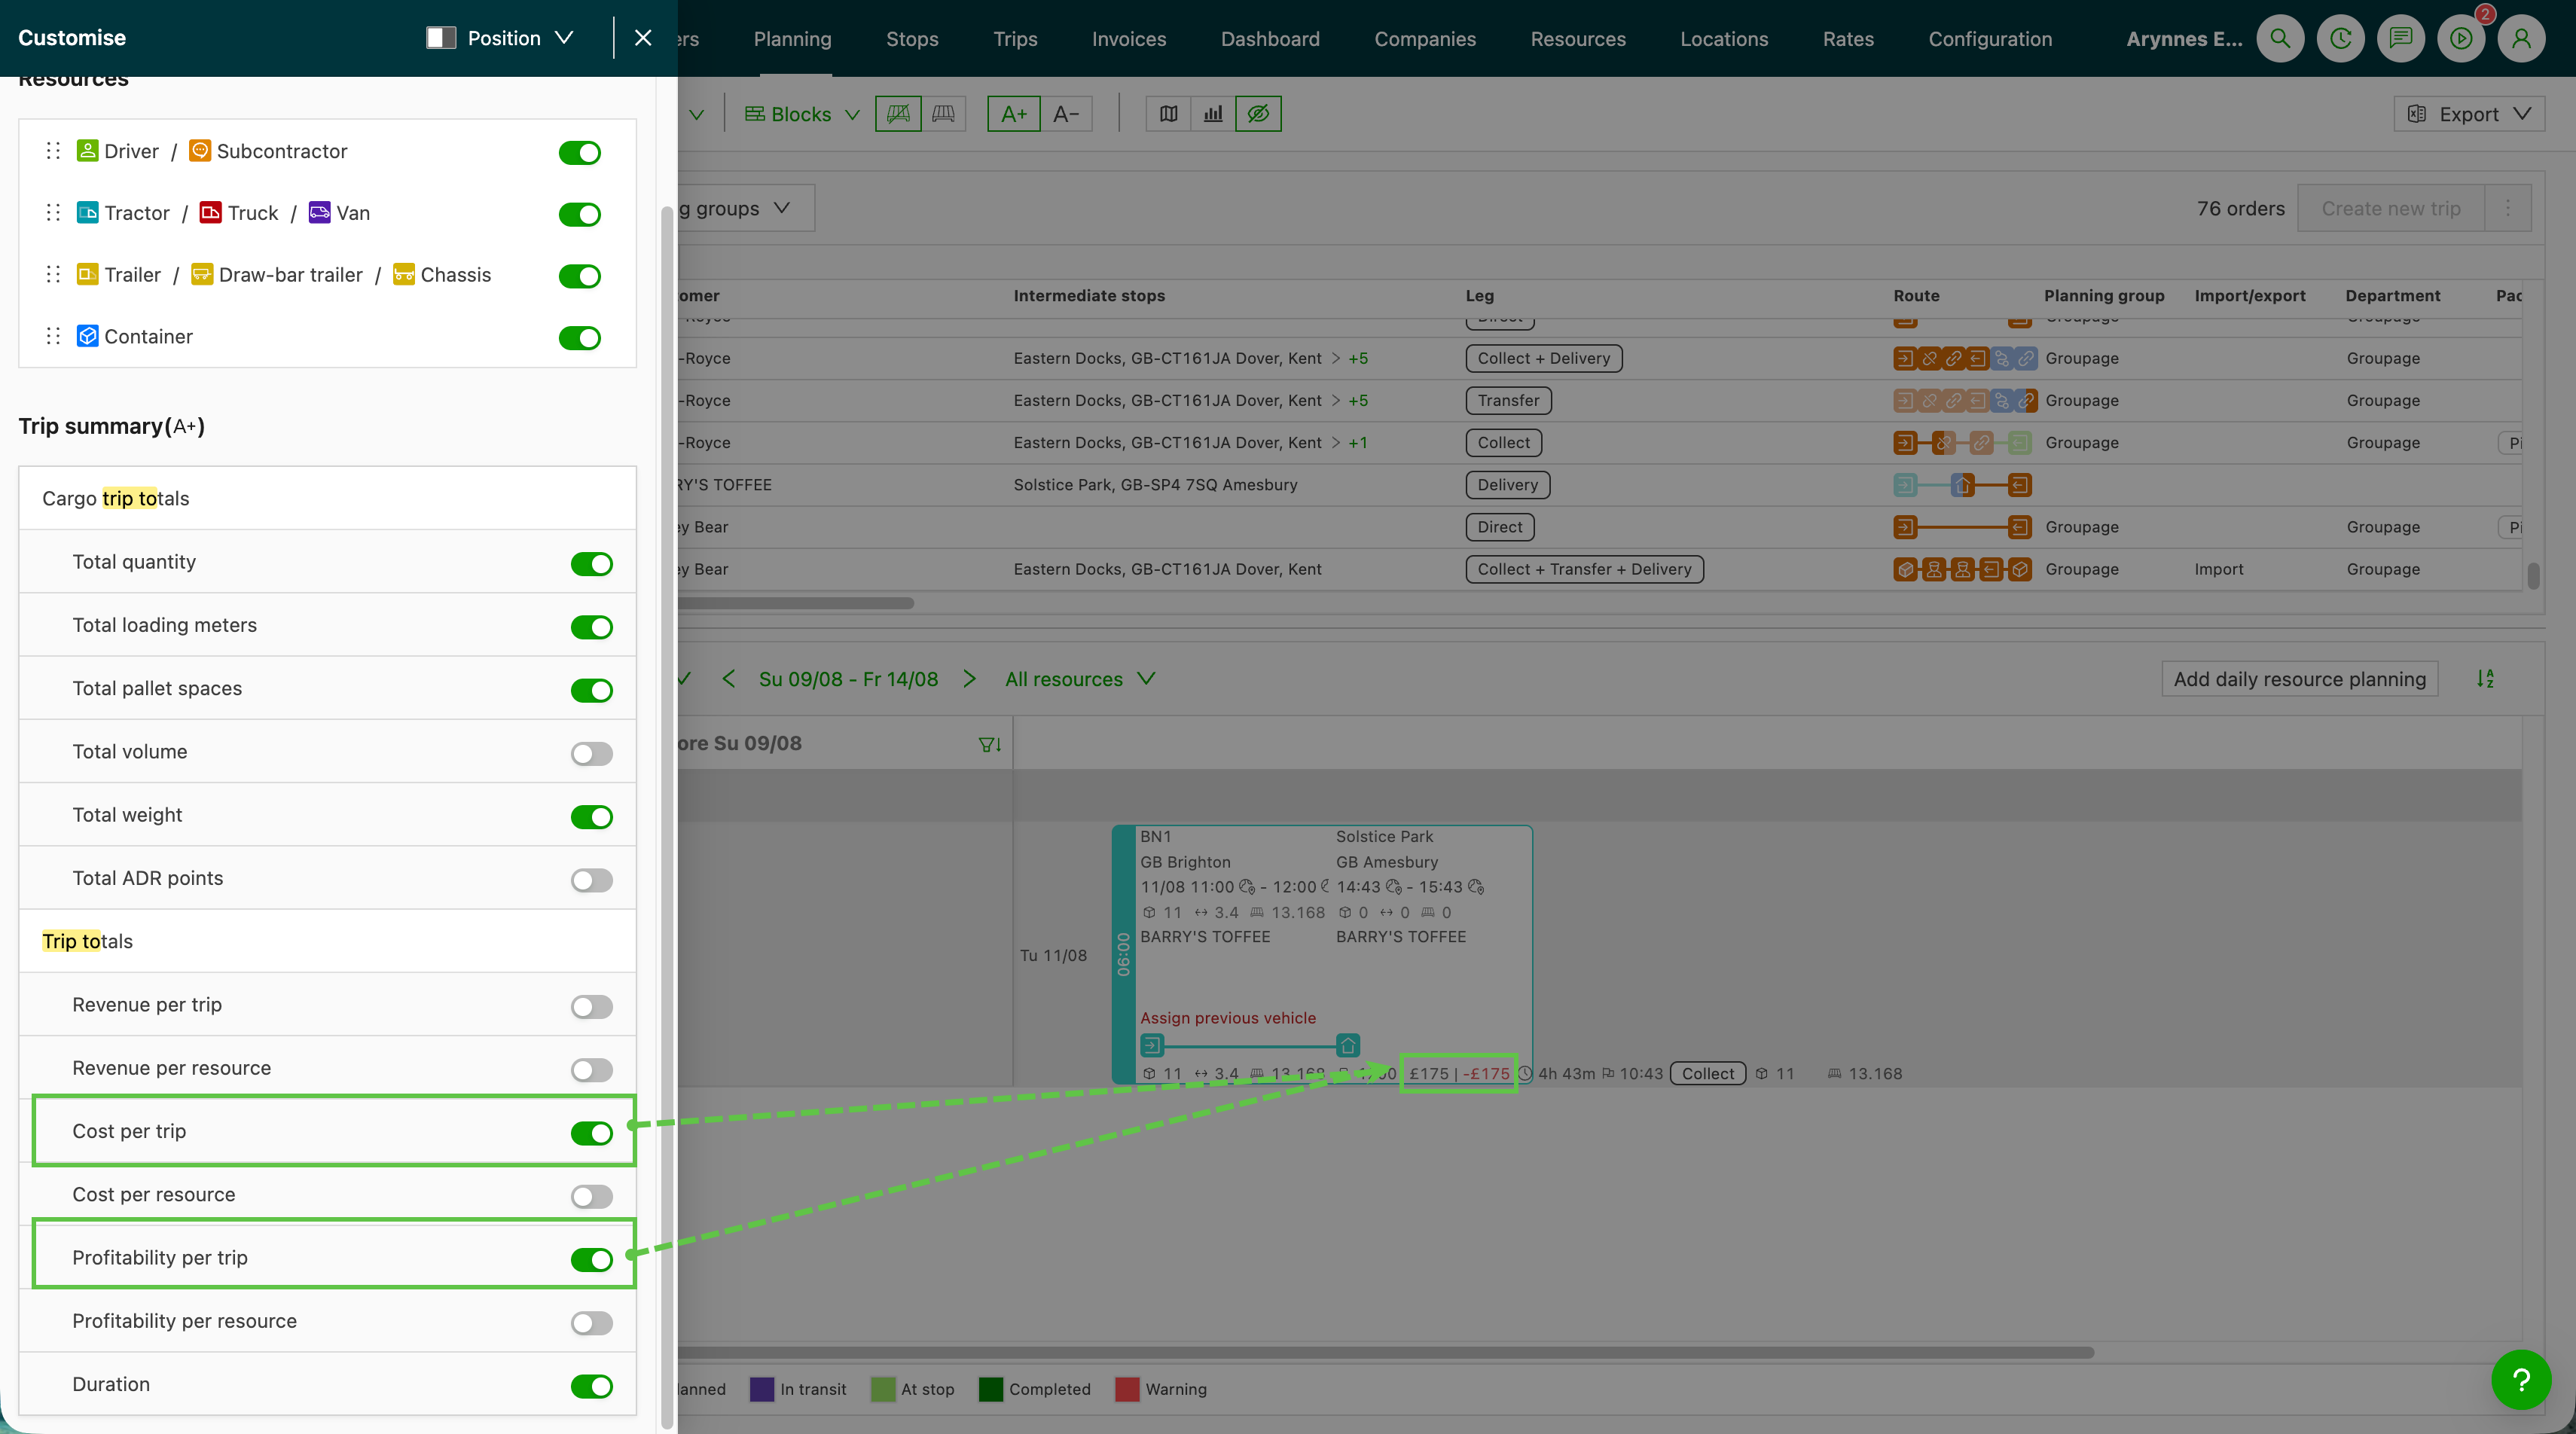
Planning – Cost and profitability totals on the planning board
Revenue splits into a per-load and a per-resource variant, and two new metrics, Cost and Profitability, arrive with the same split. This lets planners see what each load and each driver's day costs and earns directly on the planning board, without ope
Table of contents
Load totals in the Customize menu now splits revenue into a per-load and a per-resource variant. Two new metrics, Cost and Profitability, arrive with the same split.
Cost and profitability figures are stored with the load summary, so they display on the board without extra loading time.
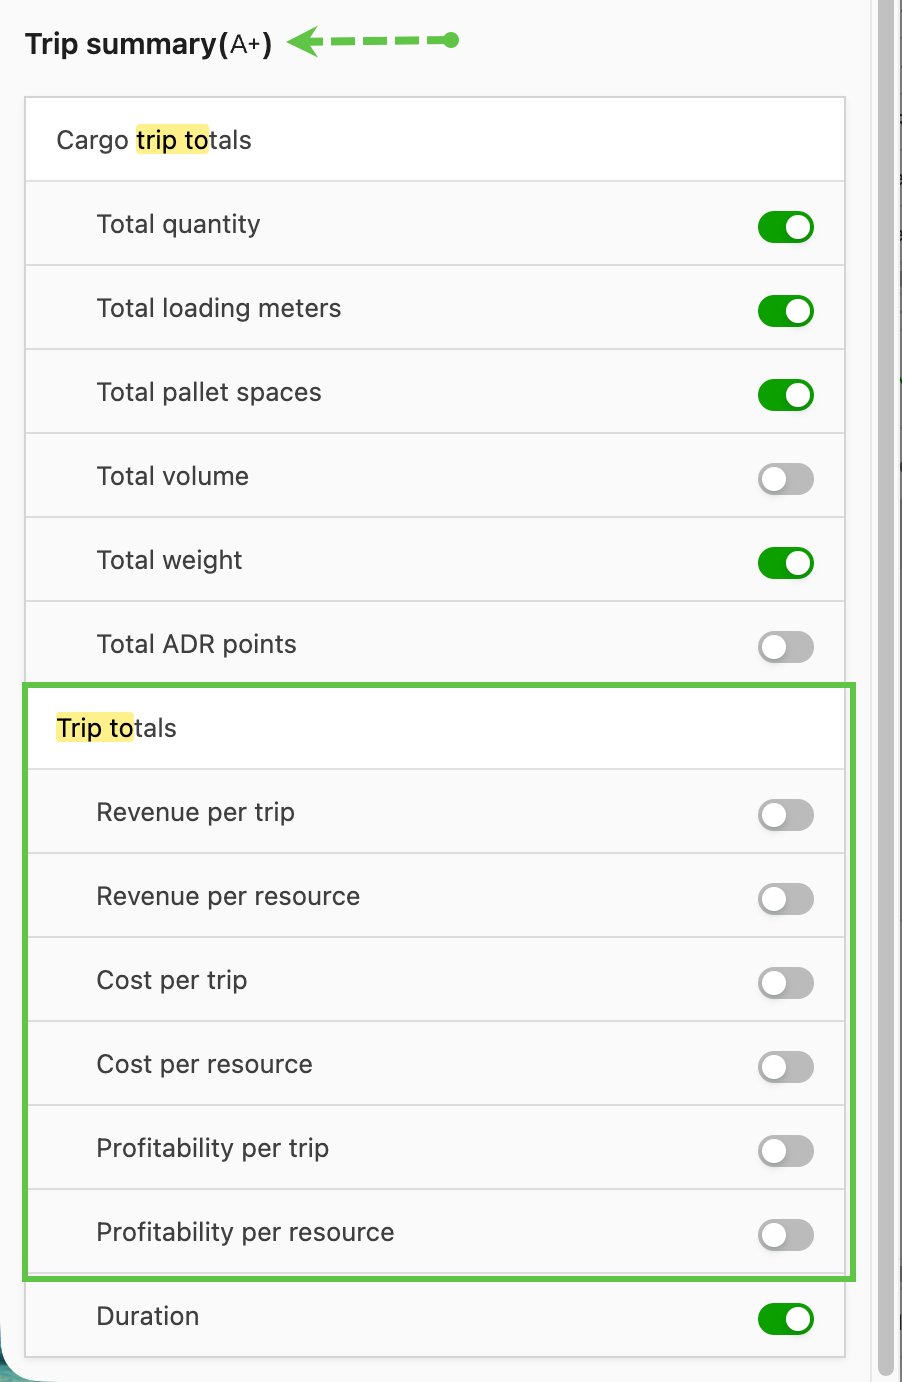
The six Load totals sub-toggles
Under Load totals in the Customize menu, the following sub-toggles are available:
- Revenue per load: shows revenue on each load block.
- Revenue per resource: shows the aggregated daily revenue next to the resource name on the left.
- Cost per load: shows total cost on each load block.
- Cost per resource: shows the aggregated daily cost next to the resource name.
- Profitability per load: shows revenue minus cost on each load block.
- Profitability per resource: shows the aggregated daily profitability next to the resource name.
Each of the six sub-toggles can be enabled independently, so a load block and a resource row can carry different metrics. The sub-toggles are available for the A+ and A- views independently.
How to enable the toggles
-
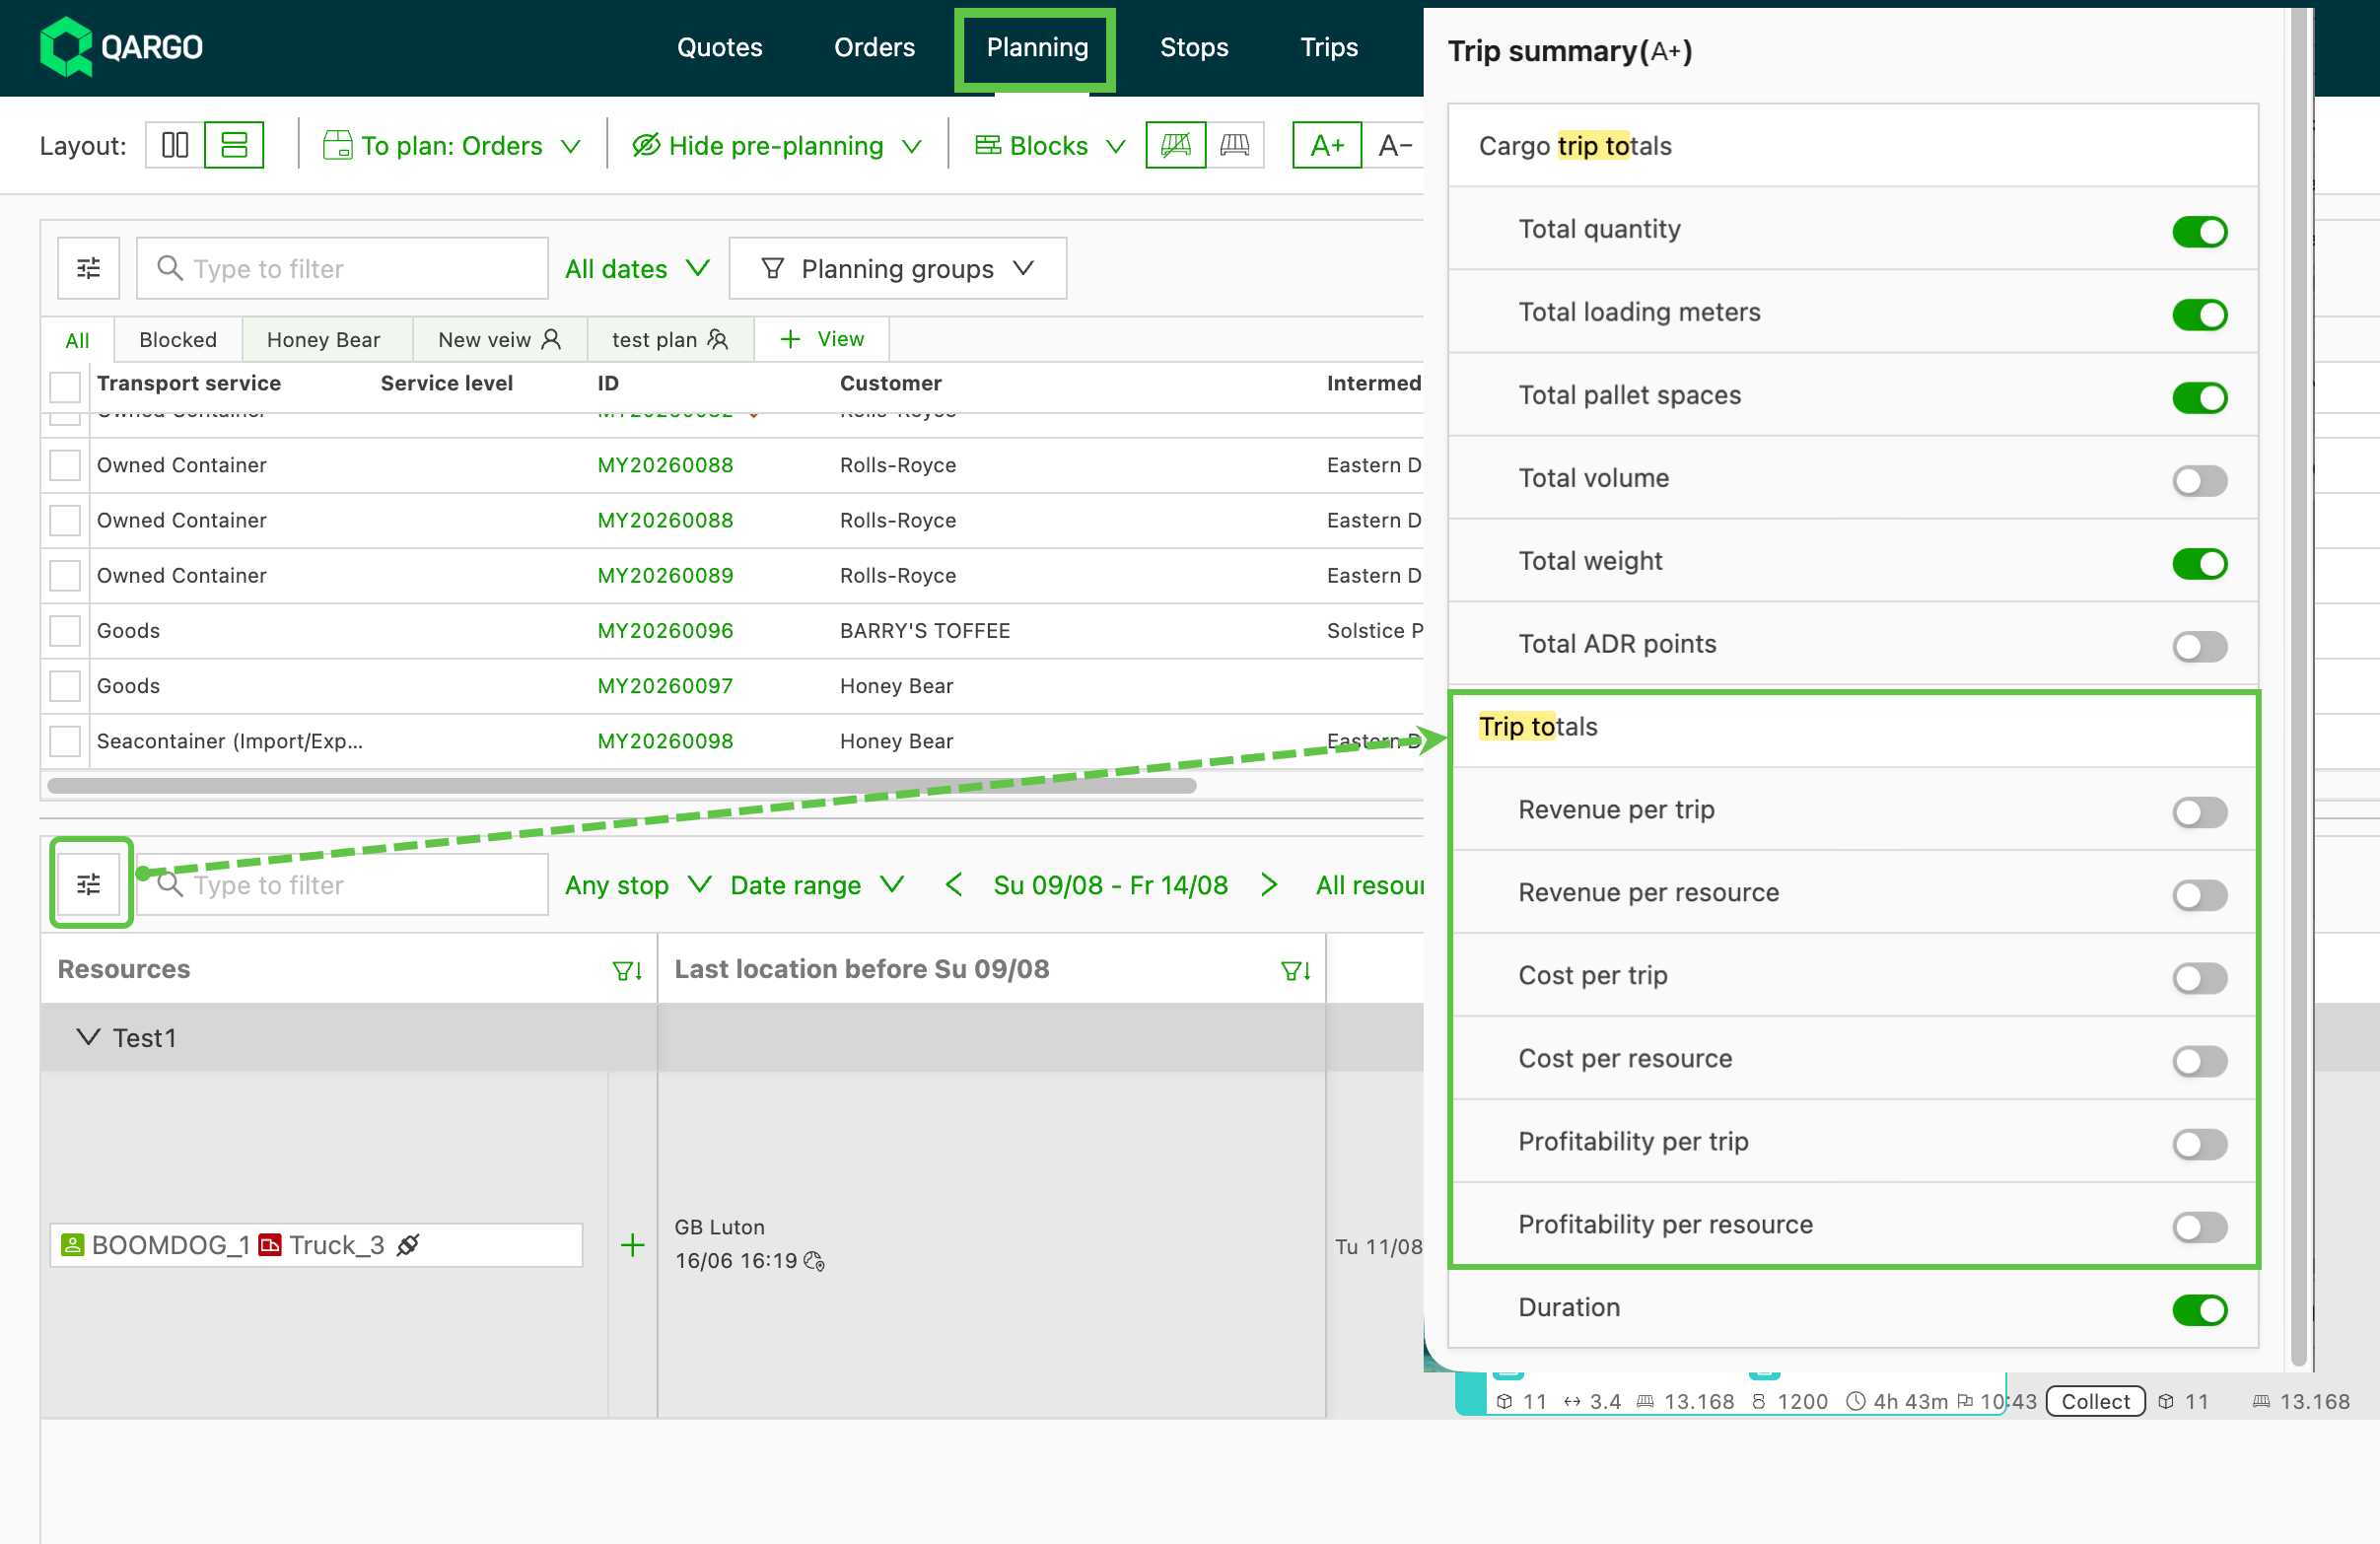
Open the planning board and click the Customize icon
-
Locate the Load totals section in the Customize menu.
-
Enable the required per-load and per-resource sub-toggles for Revenue, Cost, or Profitability.
How the figures are displayed
-
Color coding: profitability is revenue minus cost, shown in green for a profit and red for a loss.
-
Multi-currency: loads that mix currencies show one line per currency, the same way Revenue already does.
-
Multi-order loads: the figure is all order revenue minus all load costs.
-
Date range: the totals are calculated for whatever date range the planning board view is currently set to, whether that is a single day, a date range, or a date and time. Changing the view’s date range recalculates the revenue, cost, and profitability totals for that window.