
Planning – map visualization
Enhanced map visualization: planned routes, color-coded stops, and configurable marker sizes for clearer load planning.
Table of contents
Introduction
The map visualization has been upgraded to improve clarity and usability, with changes to planned routes, stop markers, and color usage. Planners and dispatchers can now understand routing, vehicle assignments, and stop-related metrics at a glance.
Key improvements include:
- Displaying planned routes in specific colors on the map.
- Improved stop markers with configurable sizes and displayed metrics.
Terminology
| Term | Definition |
|---|---|
| Planned routes | Predefined loads/routes already assigned in the system. |
| To plan stops | Stops that are not yet assigned to a planned route. |
| Legend | The control panel within the map view that allows users to turn features on/off or configure display options. |
| Stop marker | The pin/marker on the map representing a pickup, delivery, or planned stop. |
| Metrics for marker size | Configurable options that determine the stop marker size, including loading meters, pallet spaces, volume, or weight. |
Configuration
1. Planned routes visualization
-
Enable/disable routes:
-
Use the ‘Route’ toggle button in the legend to show or hide planned routes.
-
Each planned route appears in a unique color.

-
-
Stop sequences:
-
Stops along a planned route display their sequence number.
-
If multiple stops share one marker, the marker displays a
#symbol and uses multiple colors to indicate different routes.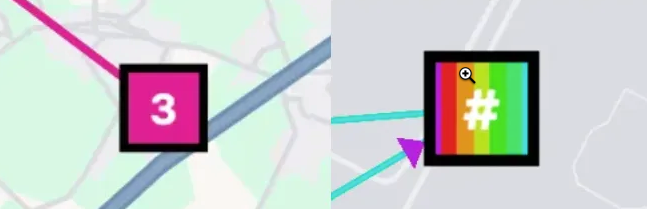
-
-
When routes are turned off:
- Routes are hidden, but stop markers remain colored to show they belong to planned routes.
- If the ‘Planned’ button is turned off, both planned routes and stops are hidden, as well as the Route toggle itself.
-
Hover interaction:
-
Hovering over a marker highlights the associated route, even if the routes are toggled off.
-
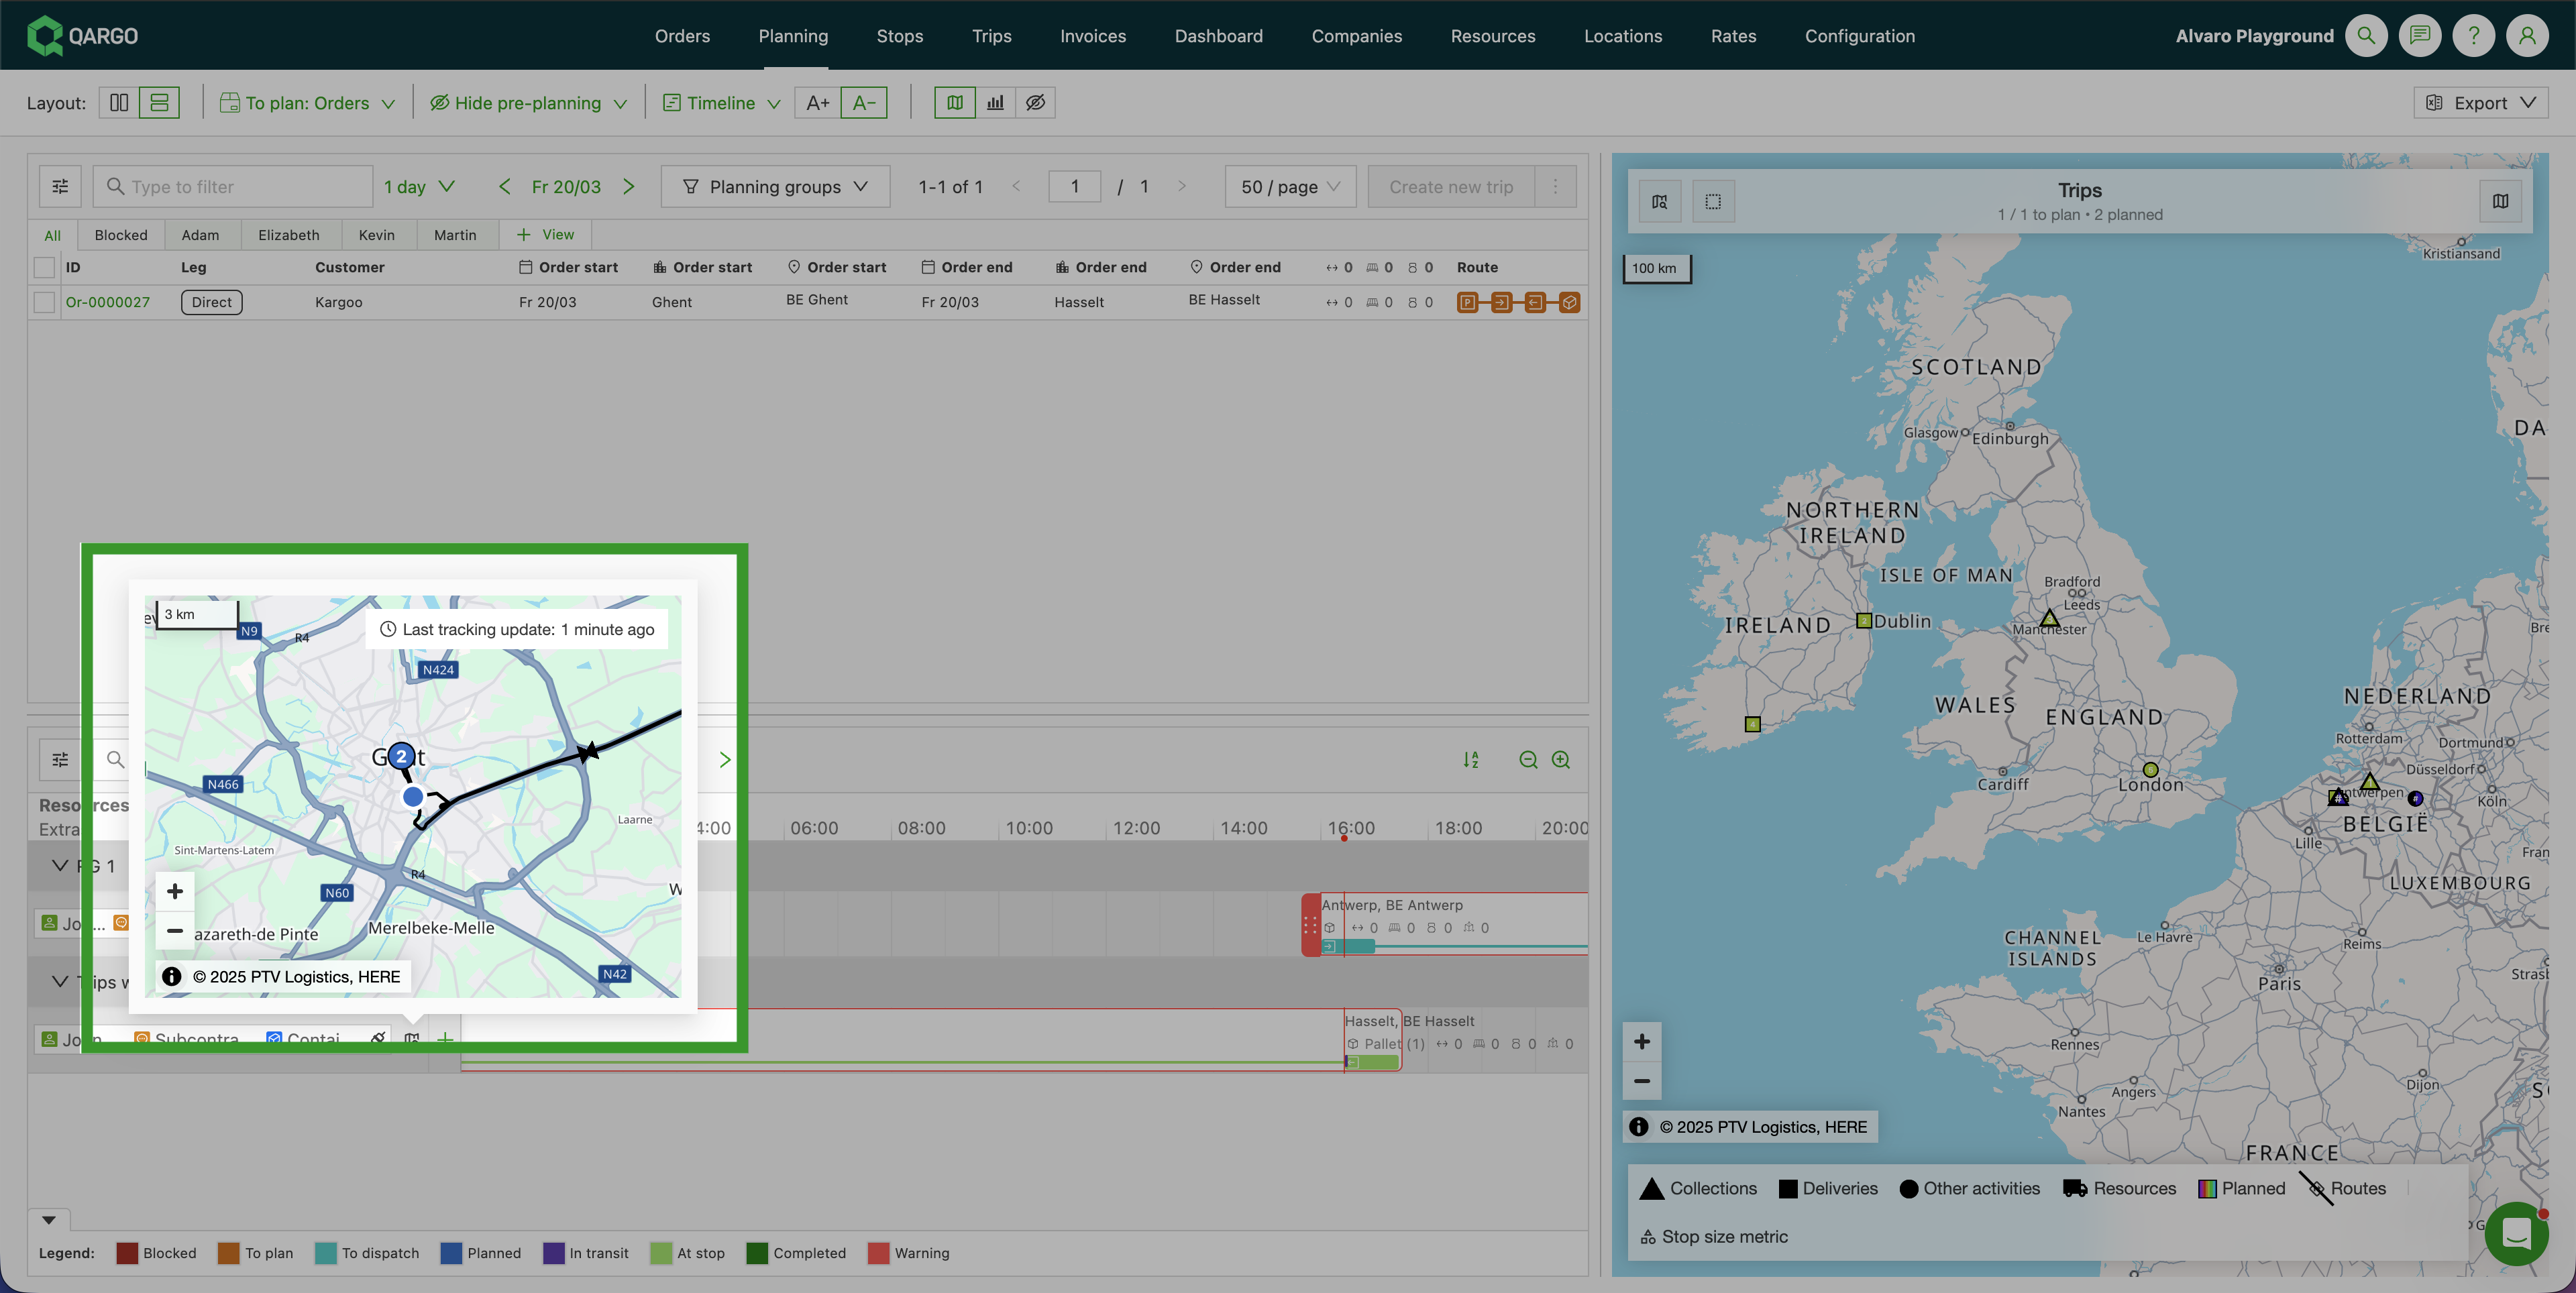
When hovering over a resource on the planning board, the tracking map popup appears and now shows:
-
The driver’s current GPS position (existing blue dot marker)
-
The active load route: numbered stop markers connected by route lines, matching the same visualization used in the load detail view:
- ▲ Triangle markers = pickup stops
- ■ Square markers = delivery stops
- ● Circle markers = other stops
-
The map stays centered on the driver’s current position at the existing zoom level. Zooming out manually shows the full route.
-
-
-
Vehicle and trailer colors:
- Trucks and trailers assigned to a load are shown in the same color as their planned route.
- Unassigned vehicles remain in their default colors.
2. Stop marker enhancements
-
Marker sizes by metric:
-
Users can configure stop marker sizes in the legend, based on:
- Loading meters
- Pallet spaces
- Volume
- Weight
-
Define thresholds for small, medium, and large markers.
-
-
Metric display:
- When size is based on loading meters or pallet spaces, the numeric value is shown on the marker.
- Example: If the metric is pallet spaces, a stop with “10” pallet spaces shows 10 on the marker.
- For To plan stops, the order’s metric value is also shown.
-
Color usage:
- To plan stops → Black markers.
- Planned stops → Marker in the color of their assigned route.
Benefits of the update
- Improved visual clarity with better use of colors.
- Faster identification of planned vs. unplanned stops.
- Clear visibility of vehicle assignments to routes.
- Customizable stop markers that reflect operational metrics.