
Dashboards: summary of options
The dashboard summary offers insight into visualization options, including revenue, profitability, and resources across the platform.
Table of contents
Revenue
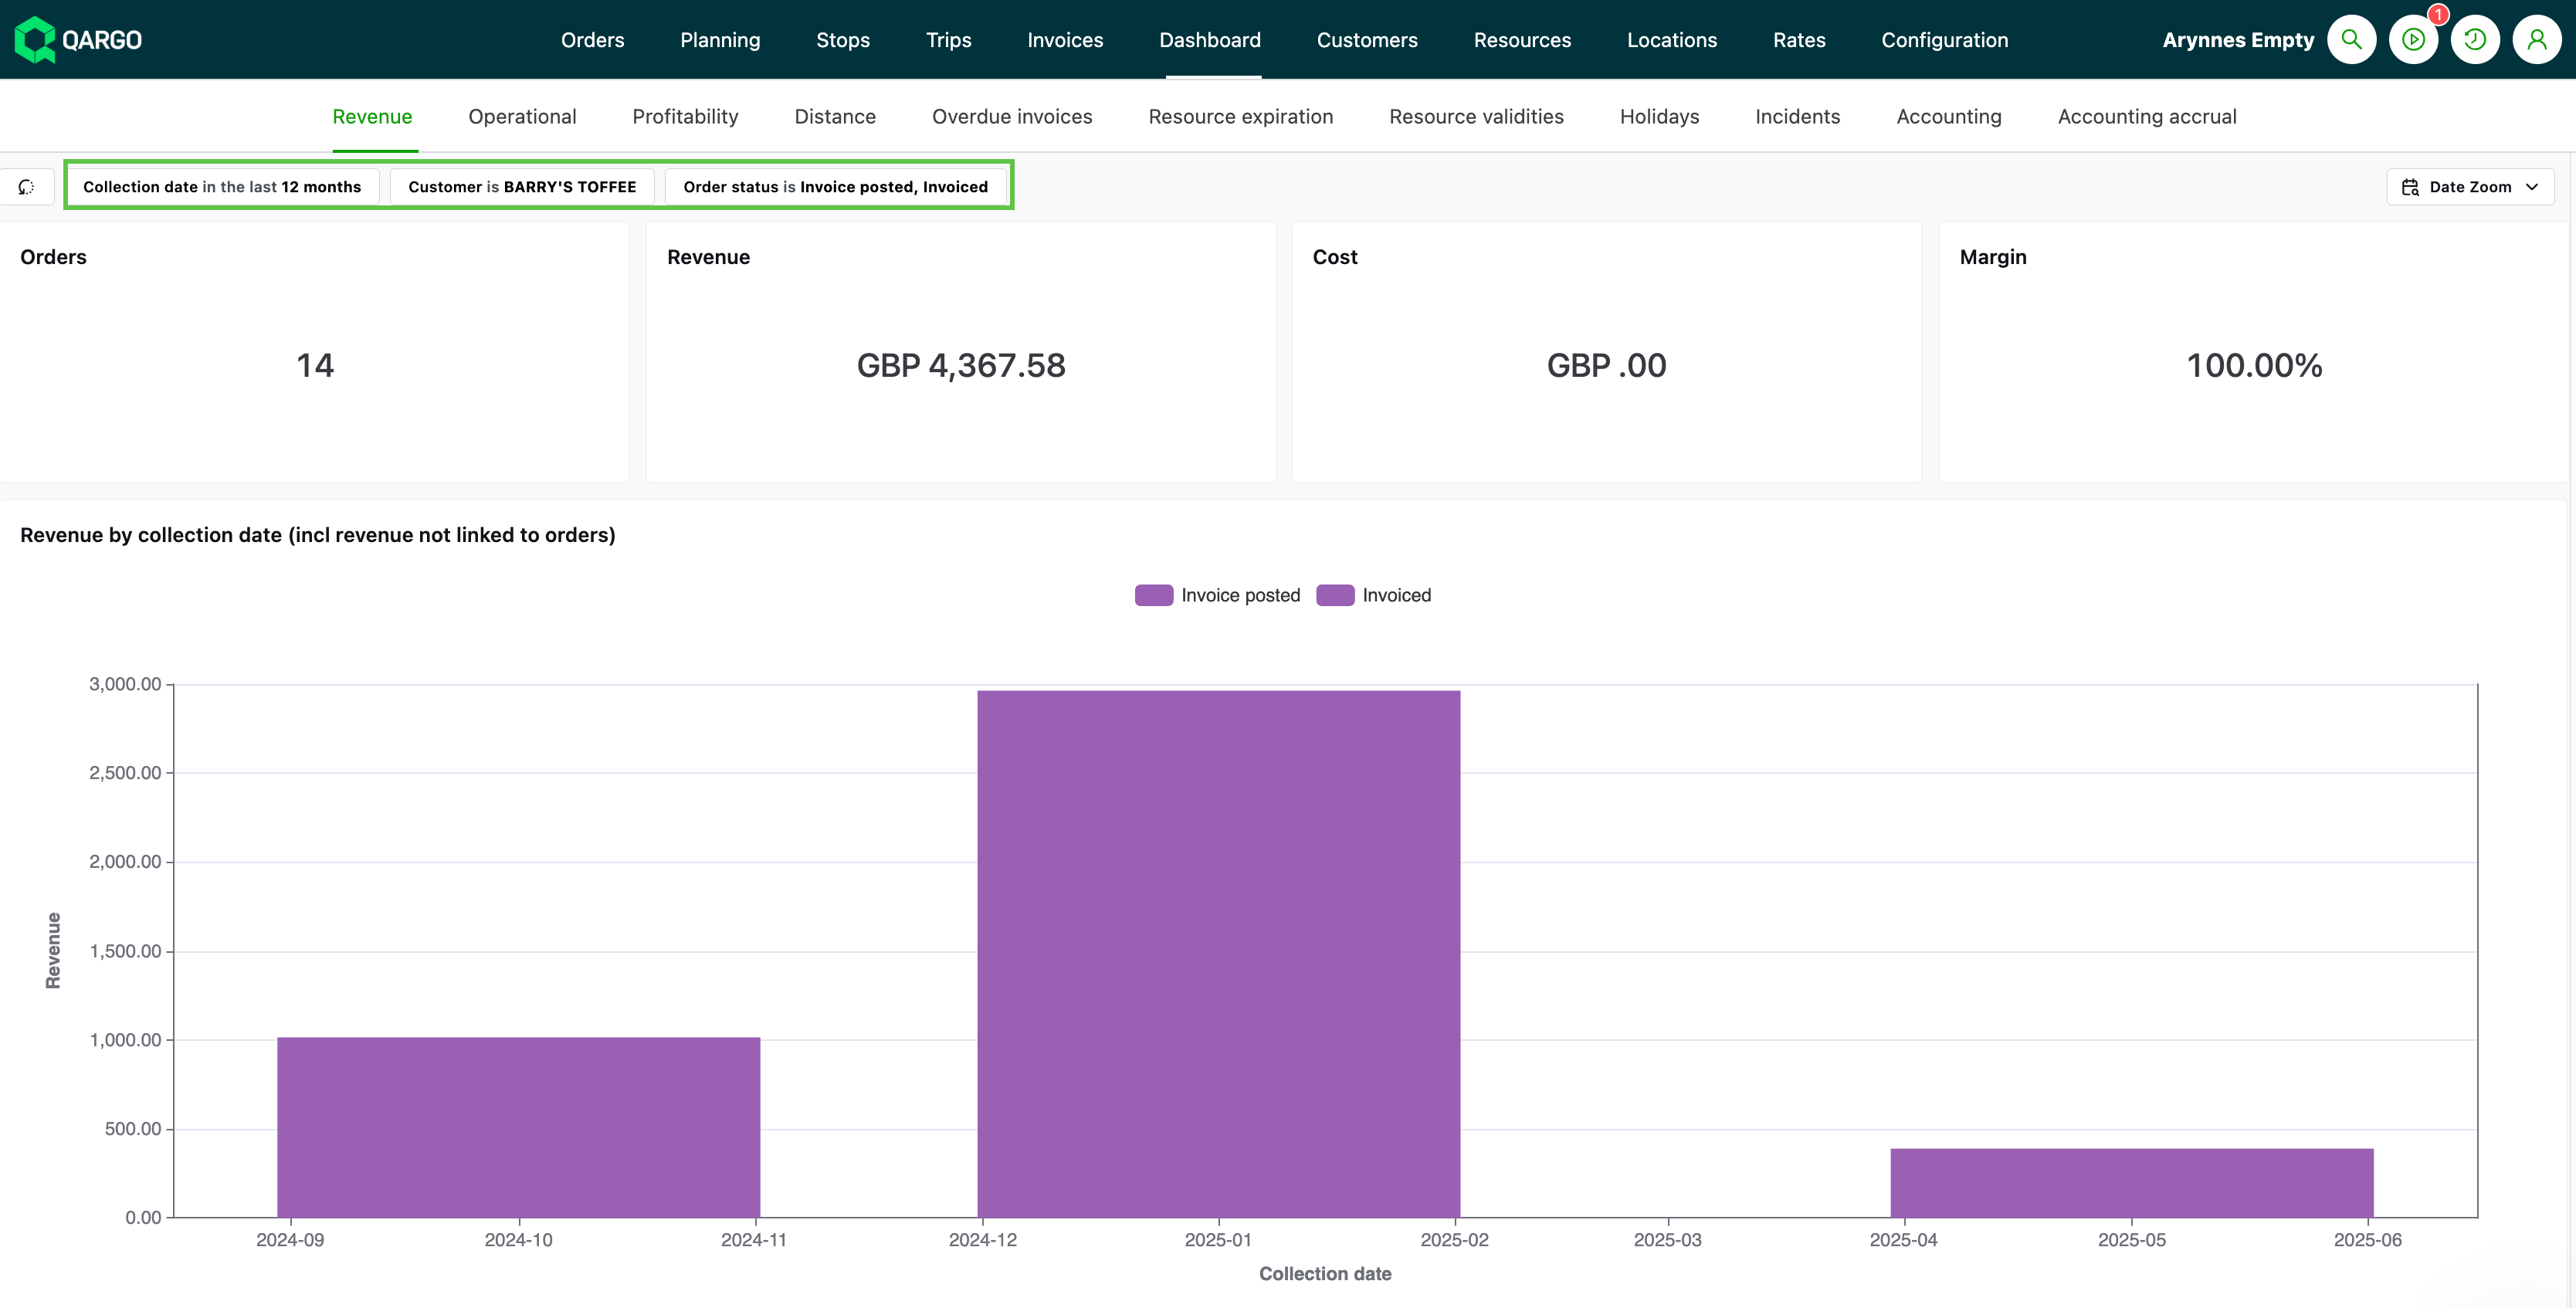
- Revenue can be filtered and grouped by order and customer
- All revenue is reported, including revenue not linked to orders, i.e., standalone invoices
- Charges marked ‘Don’t invoice’ are not included in the calculations
-
Tables include:
-
Revenue by pickup date (all revenue)
-
Revenue by transportation service
-
Revenue not linked to orders
-
Costs not linked to orders (based on carrier invoice date)
-
Profitability by order (based on pickup date / incl. revenue not linked to orders)
-
Delivered goods (spaces / meters)
-
Order details
-
Totals:
- Orders
- Revenue
- Cost
- Margin
-
Revenue per department
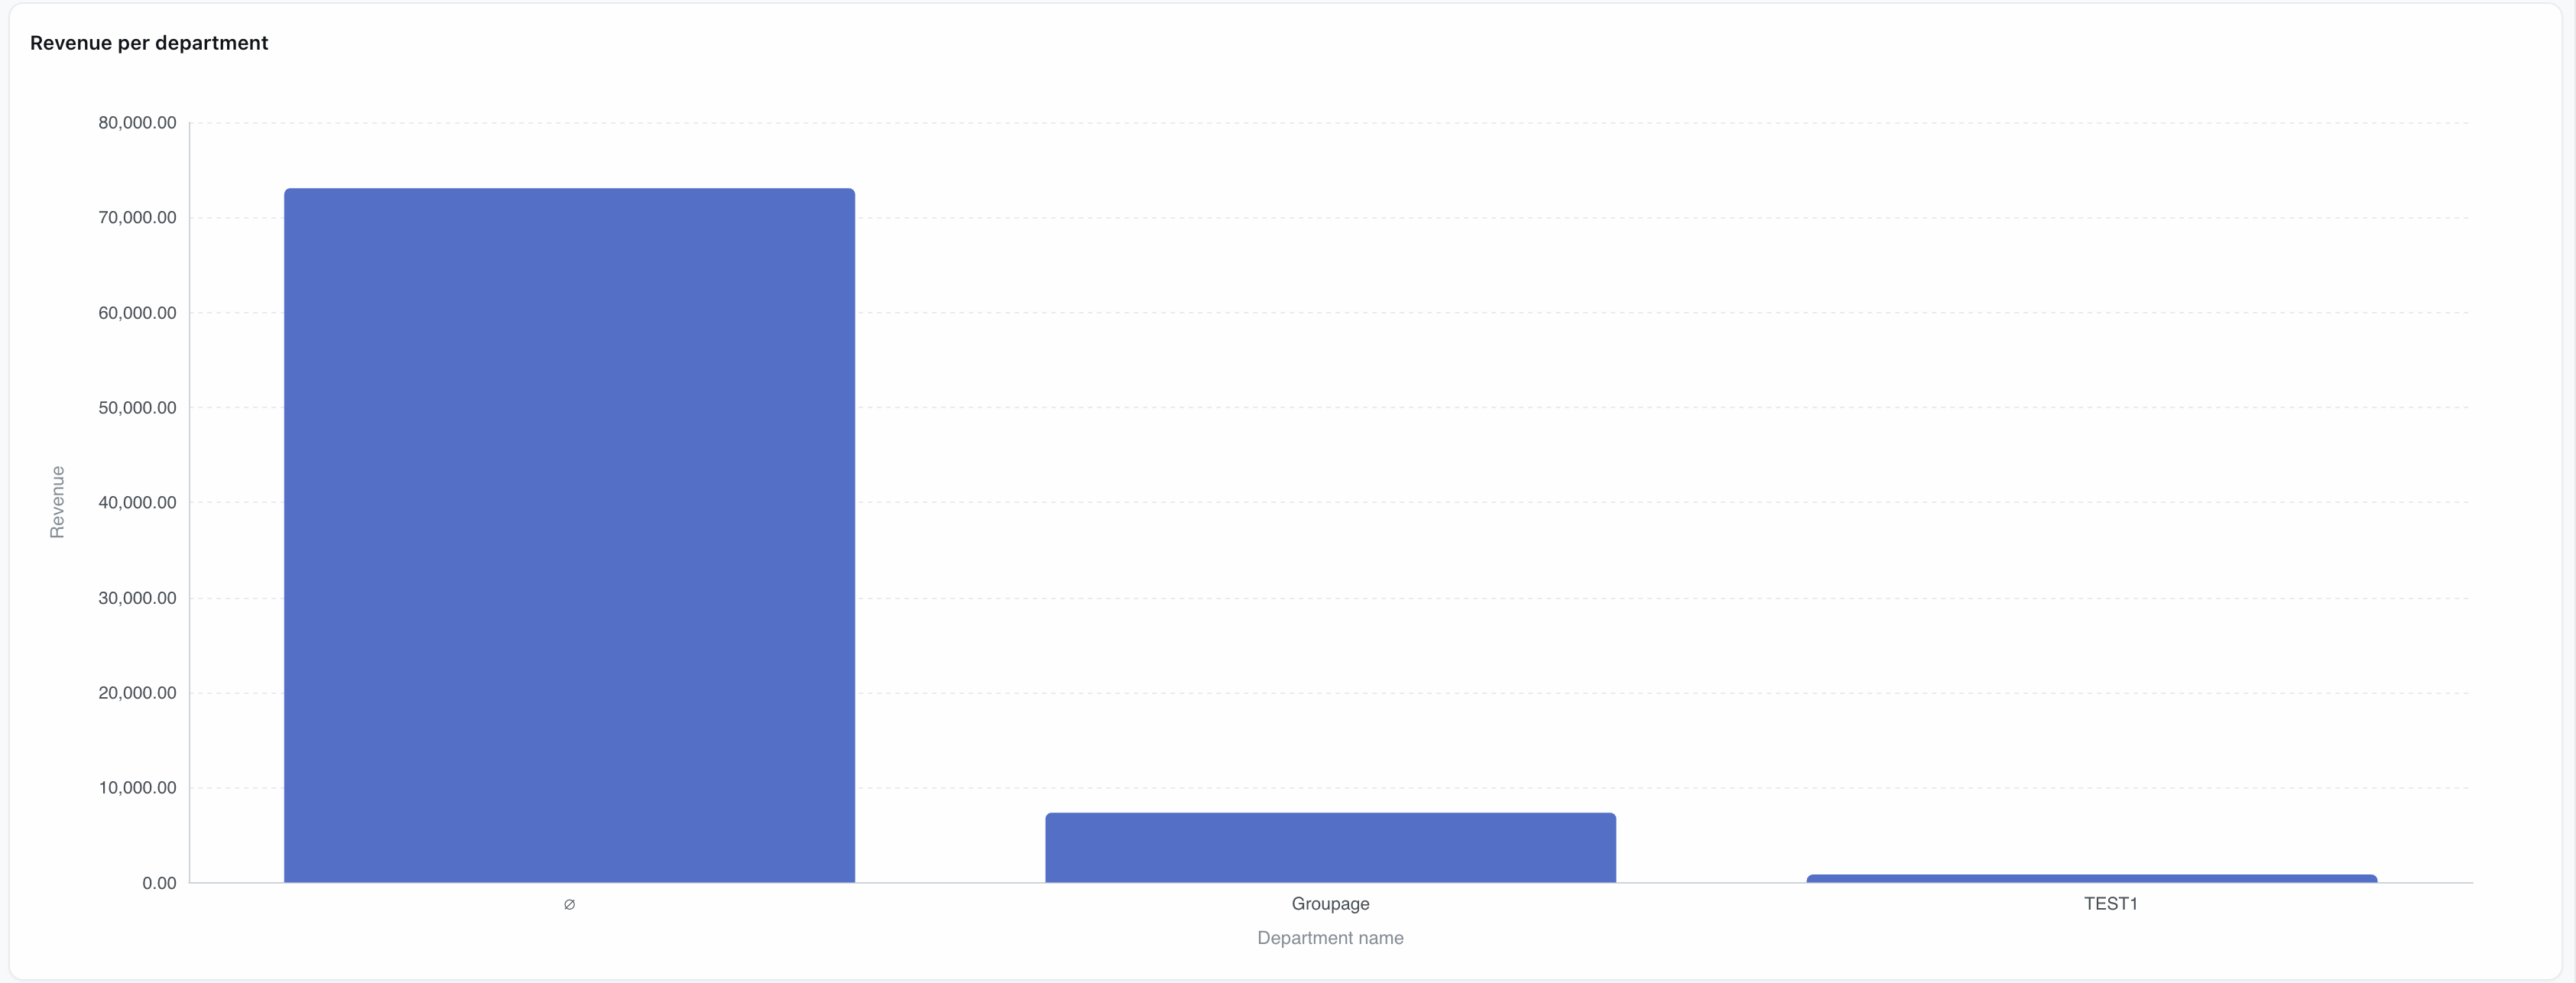
A Revenue per department bar chart is available on the Revenue dashboard. This chart breaks down total revenue by internal department, allowing finance and operations teams to analyze revenue contribution across business units.
Summary
This revenue system tracks all income (order-linked and standalone invoices) except non-billable charges. Data can be filtered by order and customer. Key reports include revenue by pickup date, costs, order profitability, delivery metrics, and summaries showing revenue by order status, top customers, and inactive accounts (60+ days). This supports both detailed analysis and strategic insights.
Fuel surcharges
The fuel surcharge dashboard gives transportation teams a real-time, consolidated view of fuel surcharge data across all customers: by customer, by time period, and at order level.
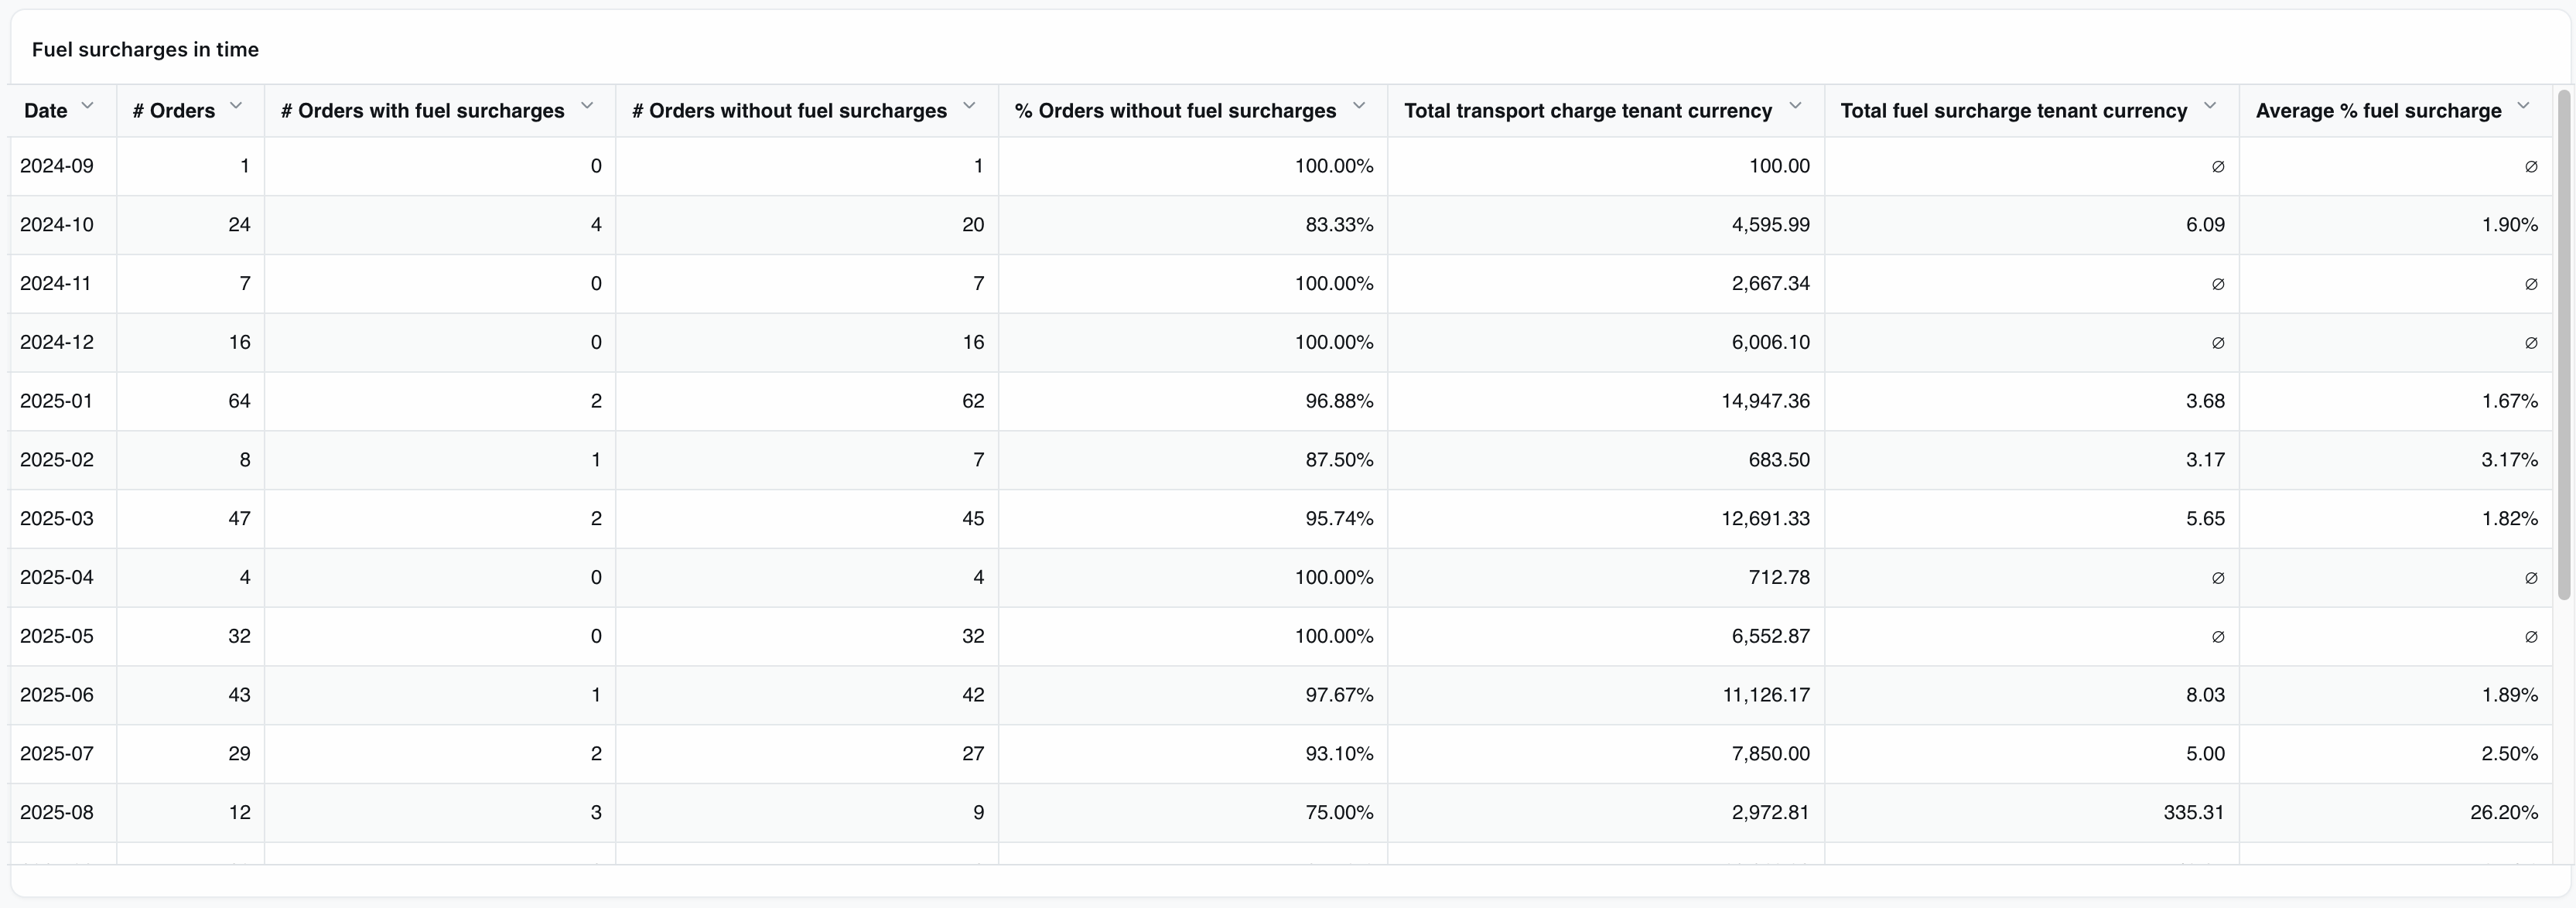
A row of summary KPIs at the top of the page (total orders, orders with/without FSC, average FSC amount and %) updates dynamically as filters are applied.
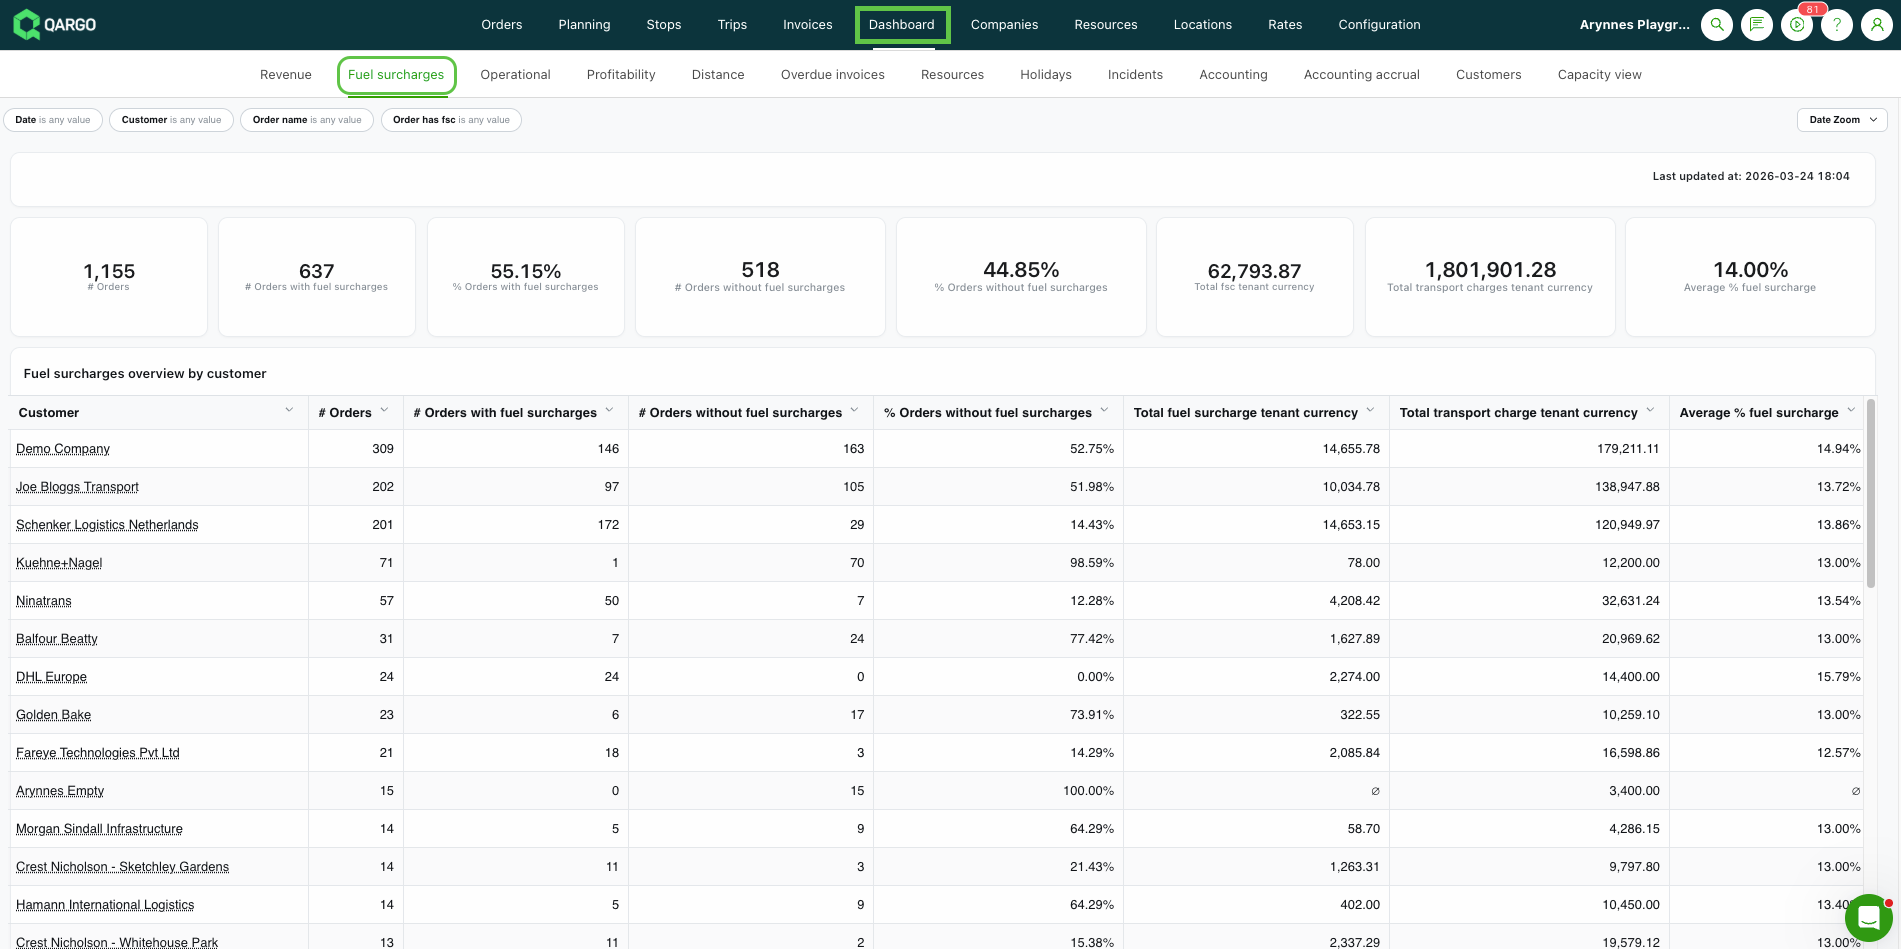
The dashboard is organized into three views:
-
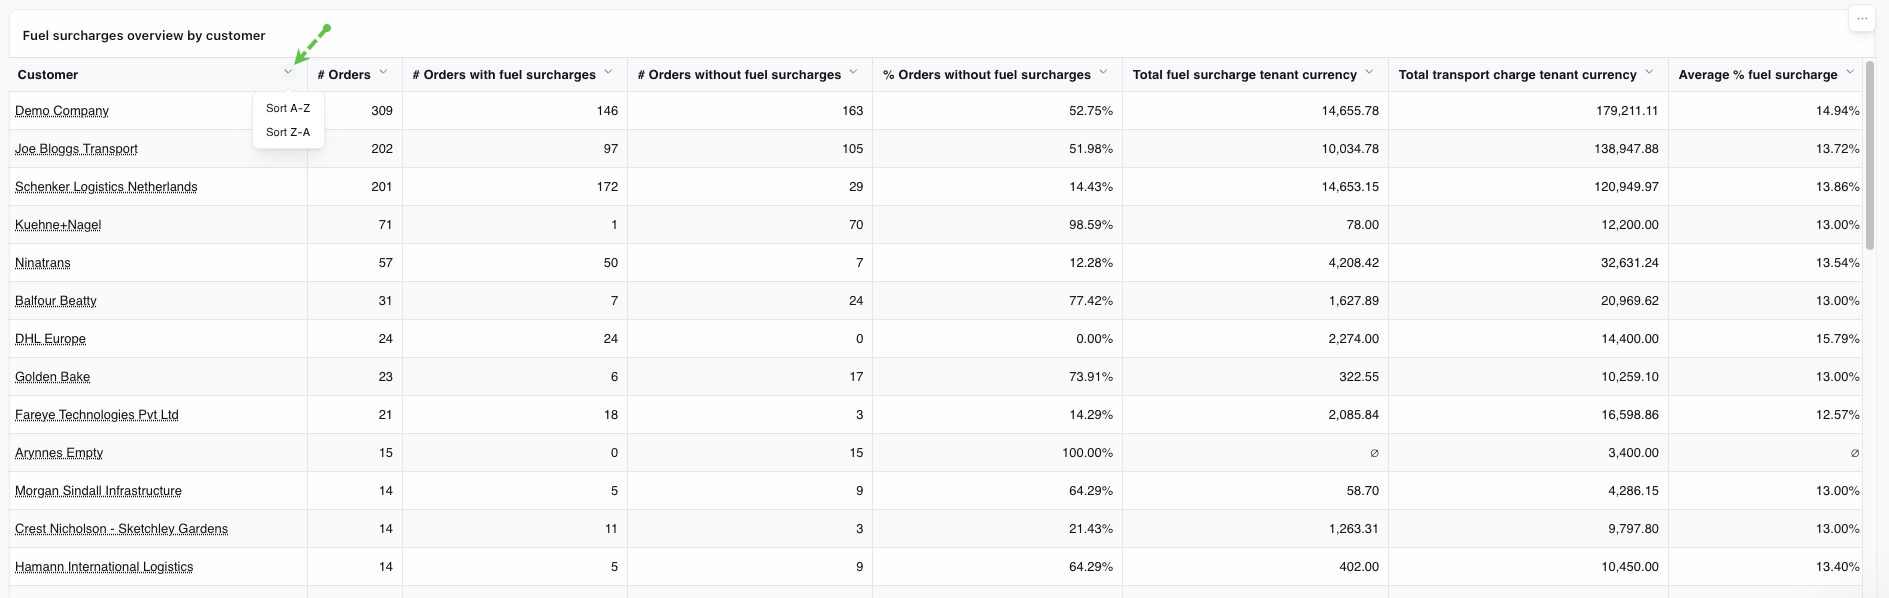
By customer — one row per customer, showing total orders, FSC counts, total charges, and average FSC percentage for the selected period
-
By time — the same data grouped by time unit (day, week, month, etc.), determined by the active date filter
-
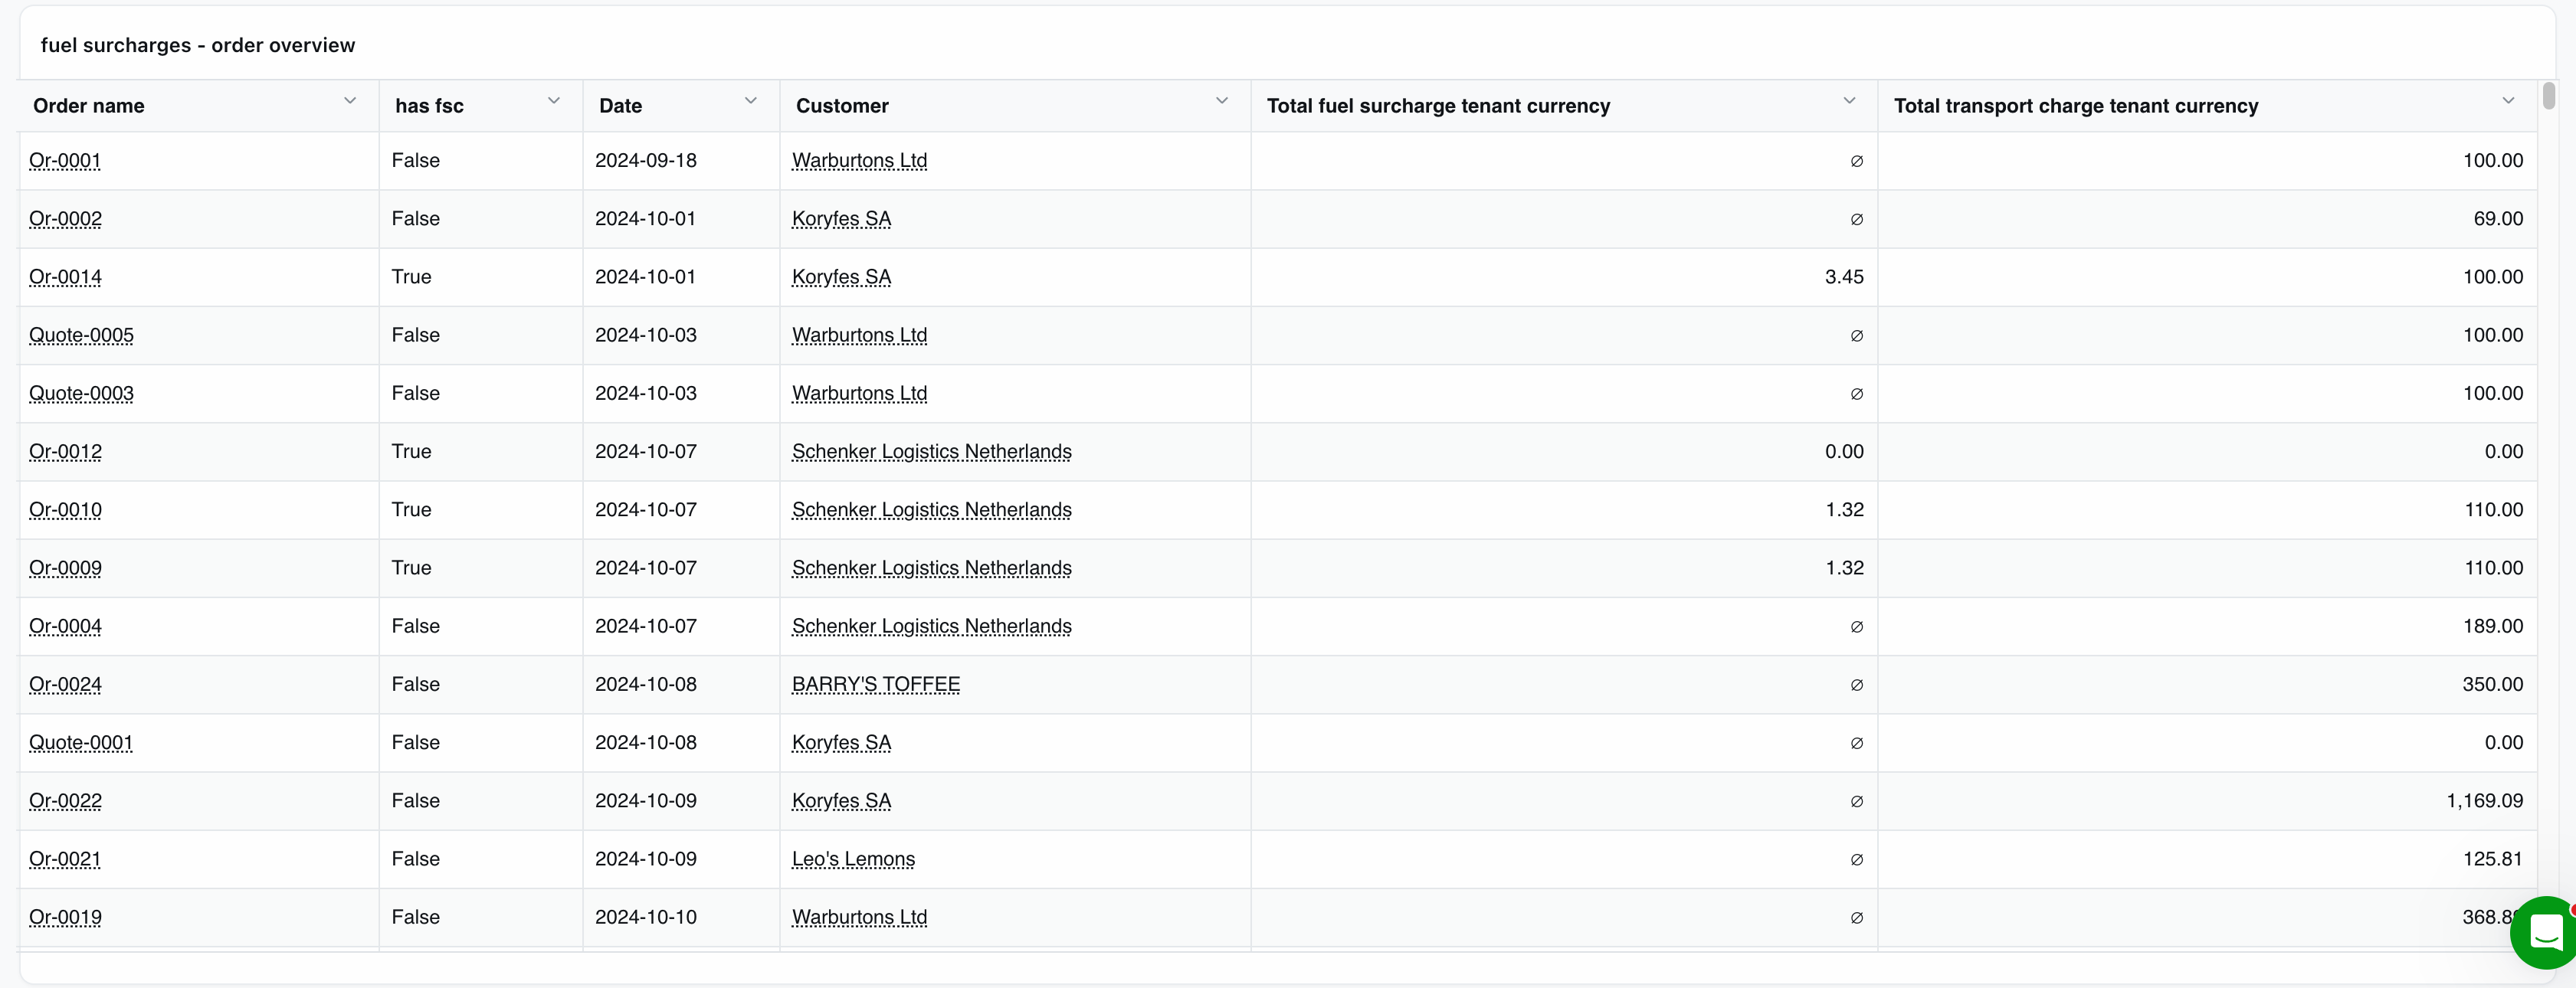
Order overview — one row per order, showing the transportation charge and FSC amount side by side
Summary
The Fuel Surcharge dashboard provides a consolidated, real-time overview of fuel surcharge (FSC) data across all customers. Transportation teams can see which customers have FSC applied, the total amounts charged, and how FSC compares to total transportation charges, without navigating individual rate cards or processing bulk exports.
Operational
-
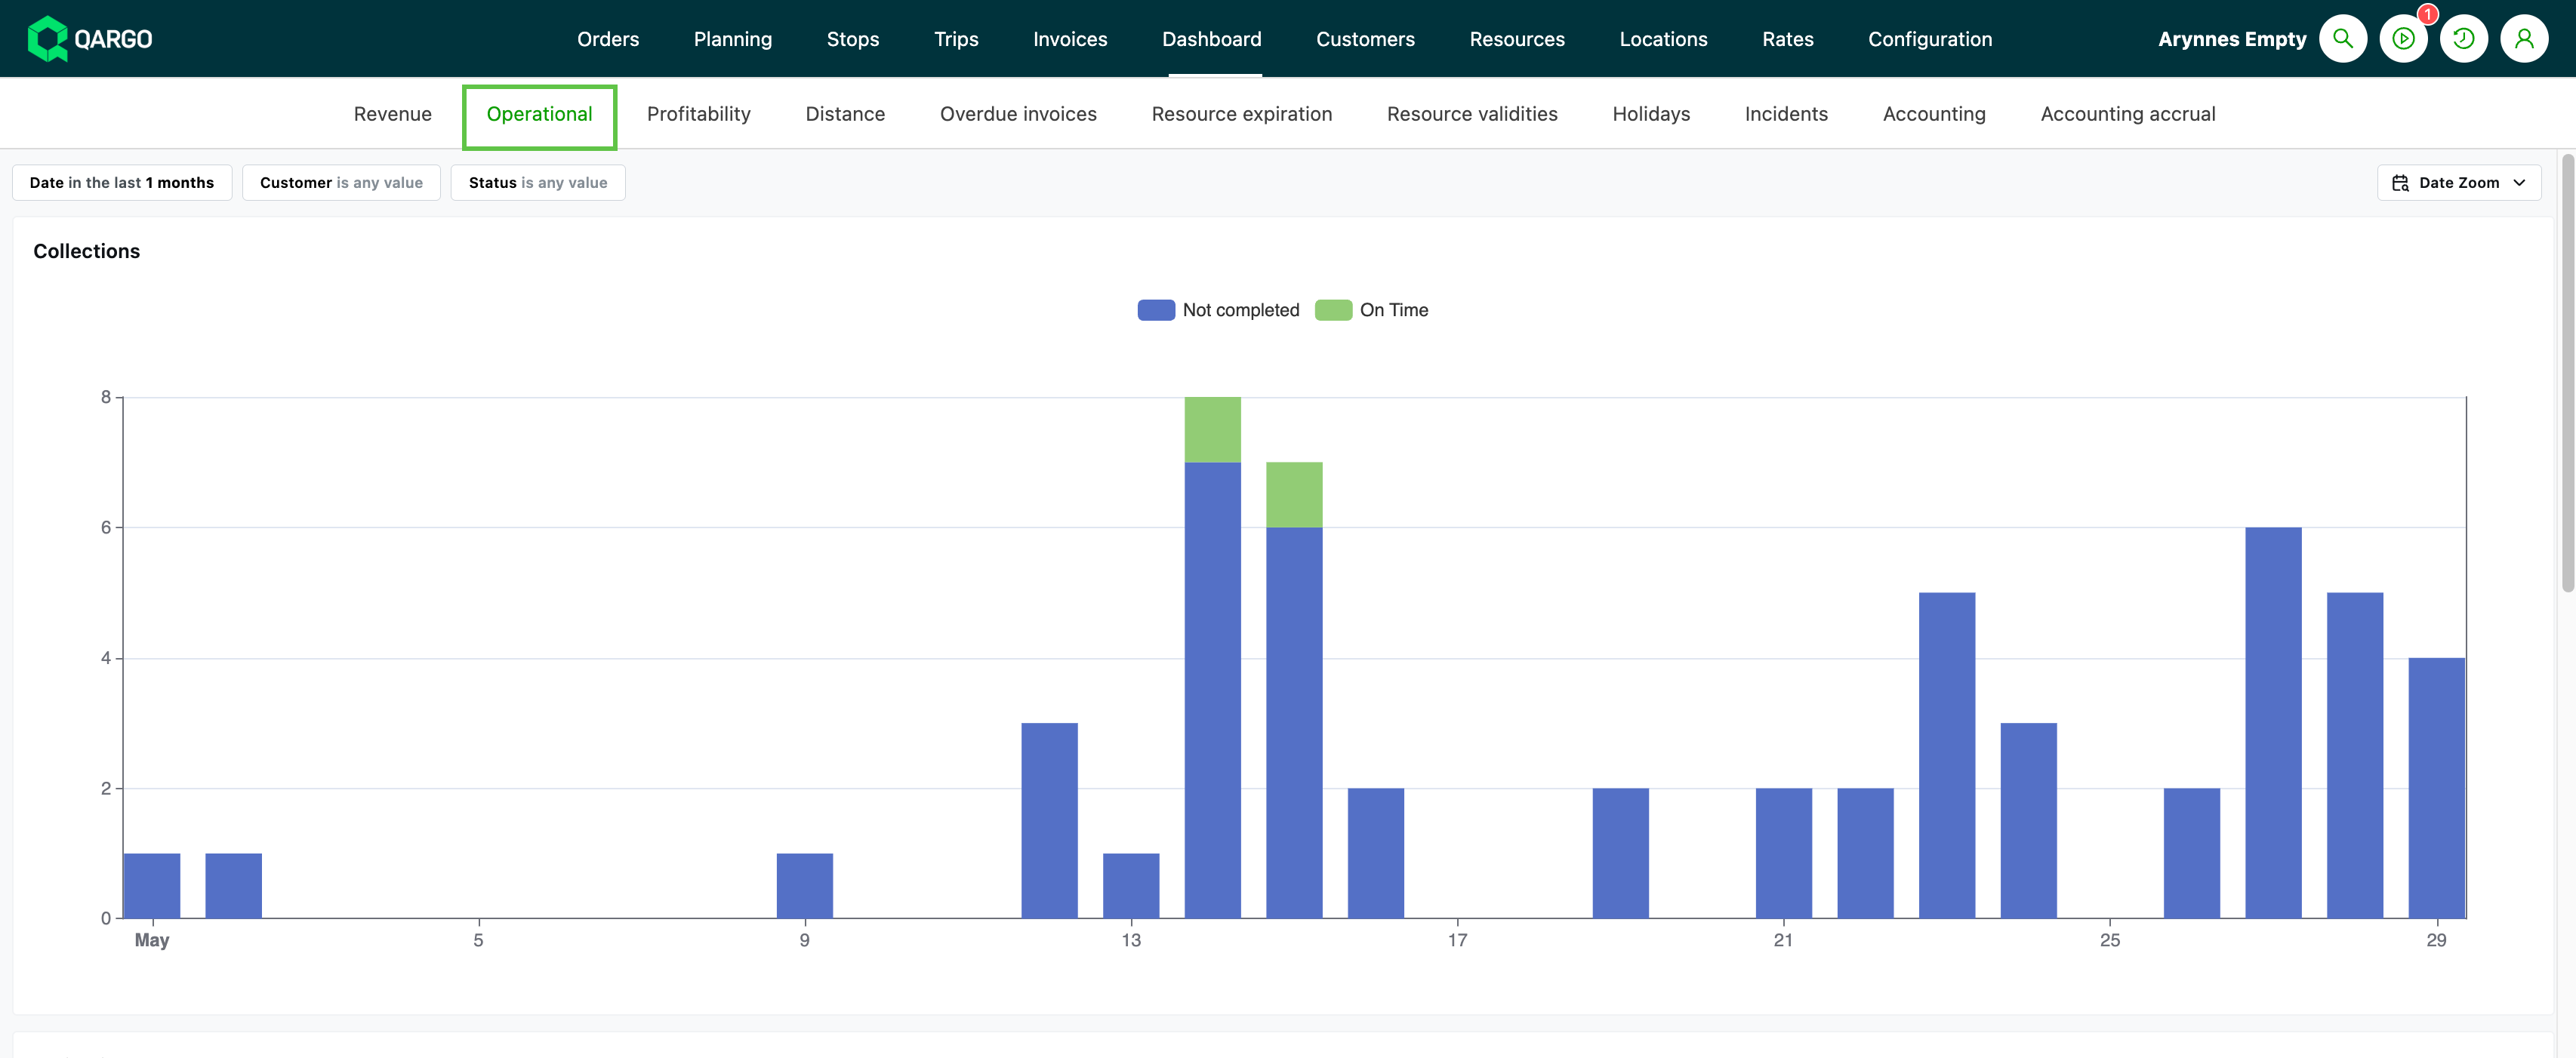
Looks at load operations, including pickups / deliveries / on-time reports / customer volume
-
Data shown includes:
- Number of pickups
- Number of deliveries
- On-time performance (% of on-time vs. late stops)
- Customer order volume
- Distance metrics (total miles by load or resource)
Summary
Operational dashboards aggregate and filter logistics activity data (loads, pickups, deliveries, resource availability, incidents) for historical and trend analysis, using structured metrics and well-defined filters for detailed operational monitoring.
Profitability
-
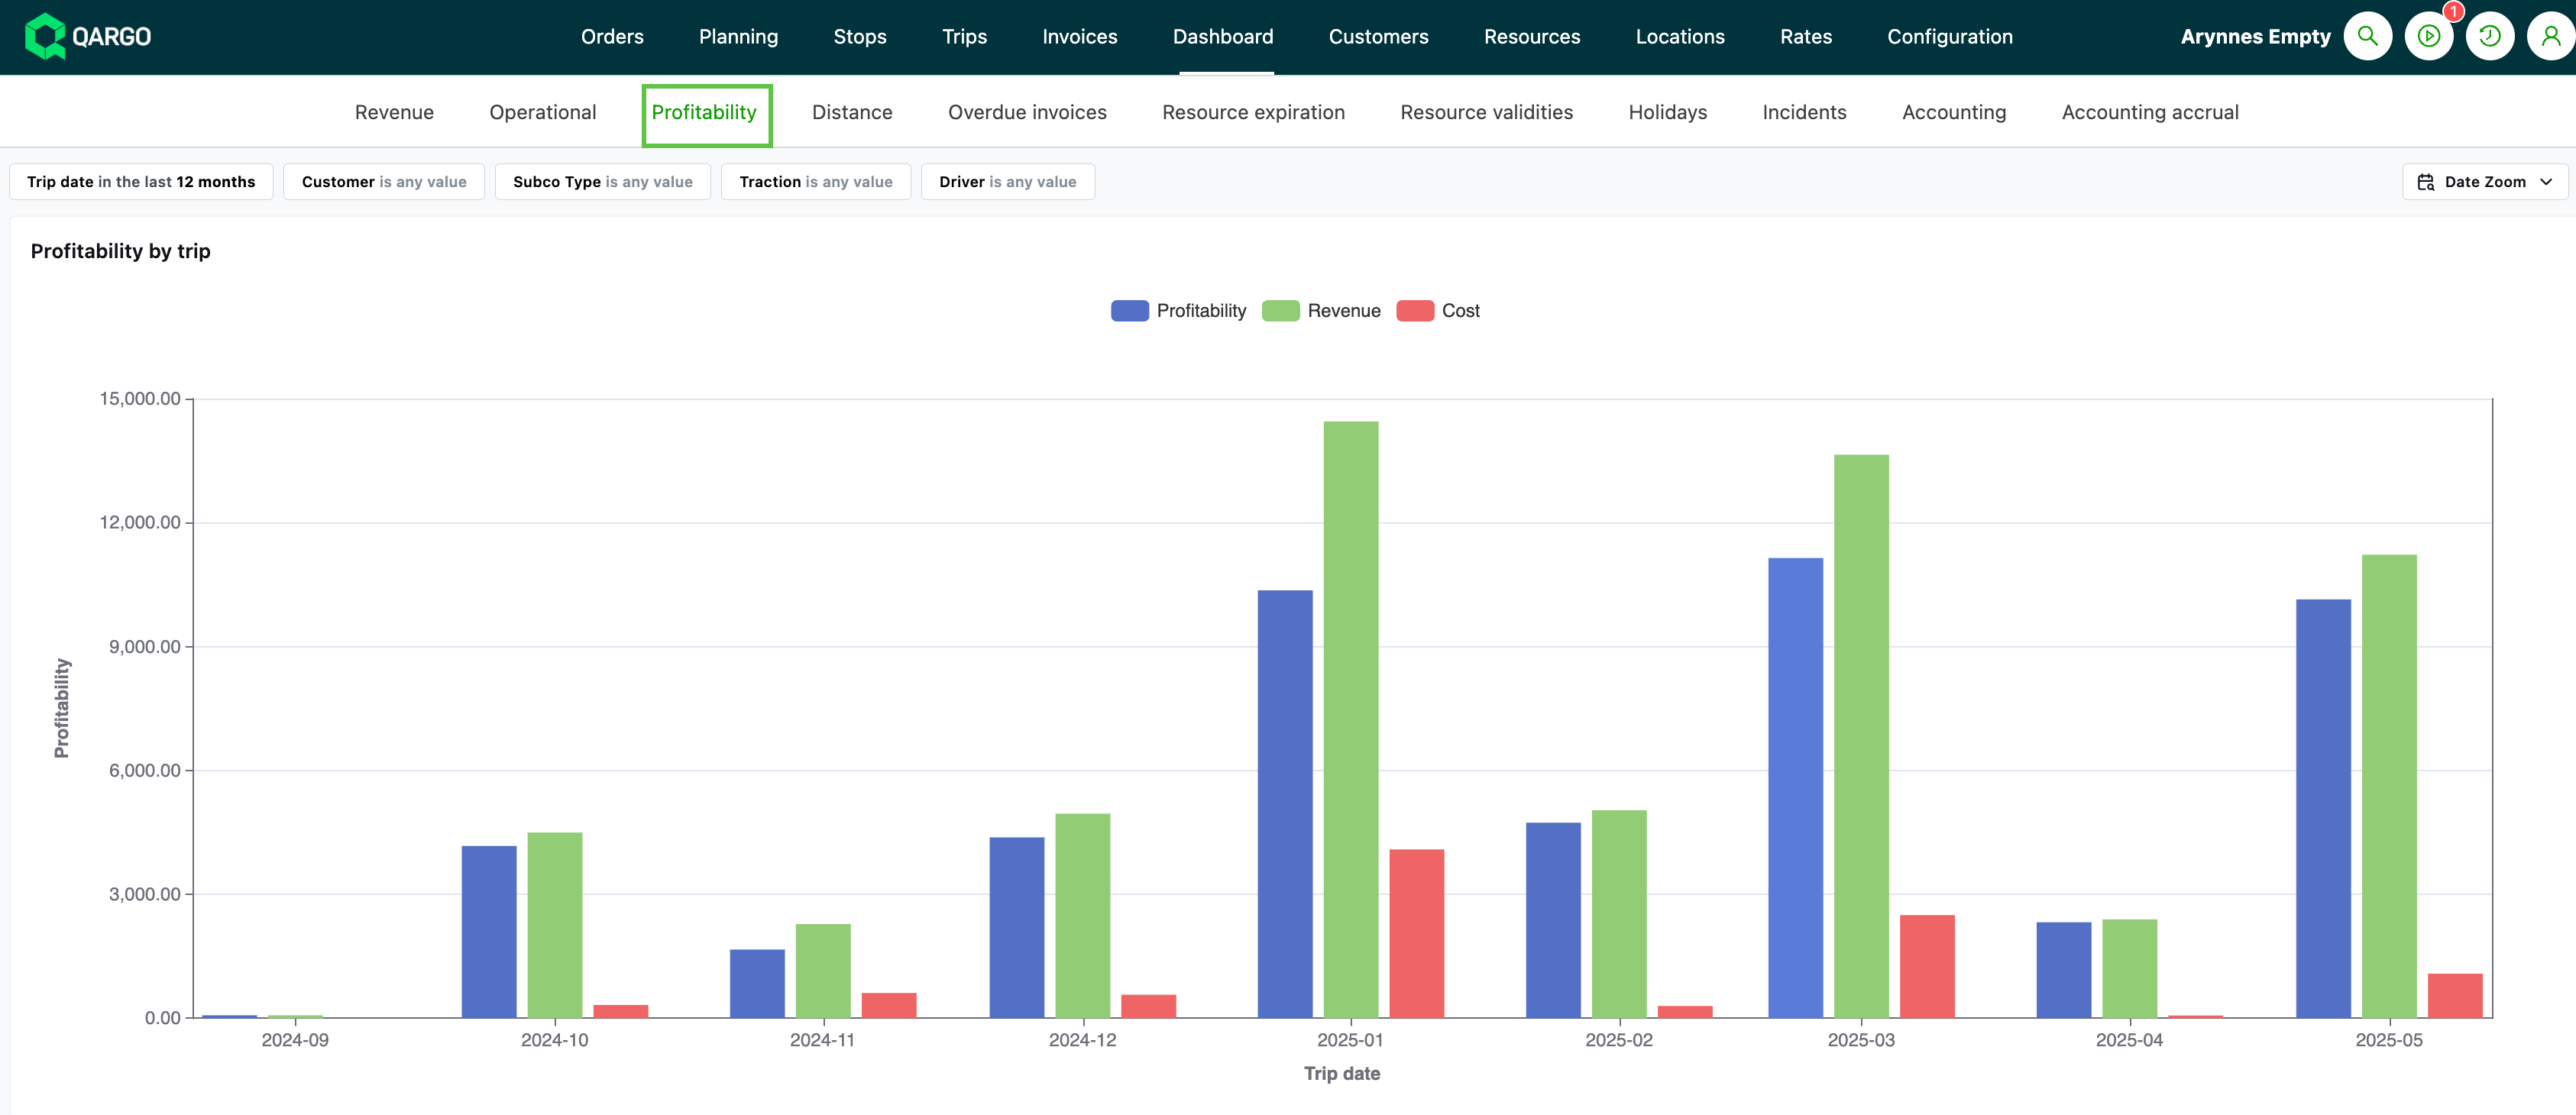
Profitability is displayed at various levels, including by load, by driver, by resource, and by order
-
Calculated as the difference between revenue and cost
- Only for revenue lines that have an associated cost
-
All values shown in base currency for consistency
-
Table columns with click-through or copy links to source data, including:
-
Profitability by load
- Order ID, status
-
Revenue / cost overview
-
Revenue / cost overview by resource
-
Distance
-
Summary
The profitability figure equals revenue minus cost, but only revenue with an associated cost is included in the calculation. This ensures that the margin shown reflects only fully costed revenue. Users should keep this in mind when interpreting the reported figures.
Distance
-
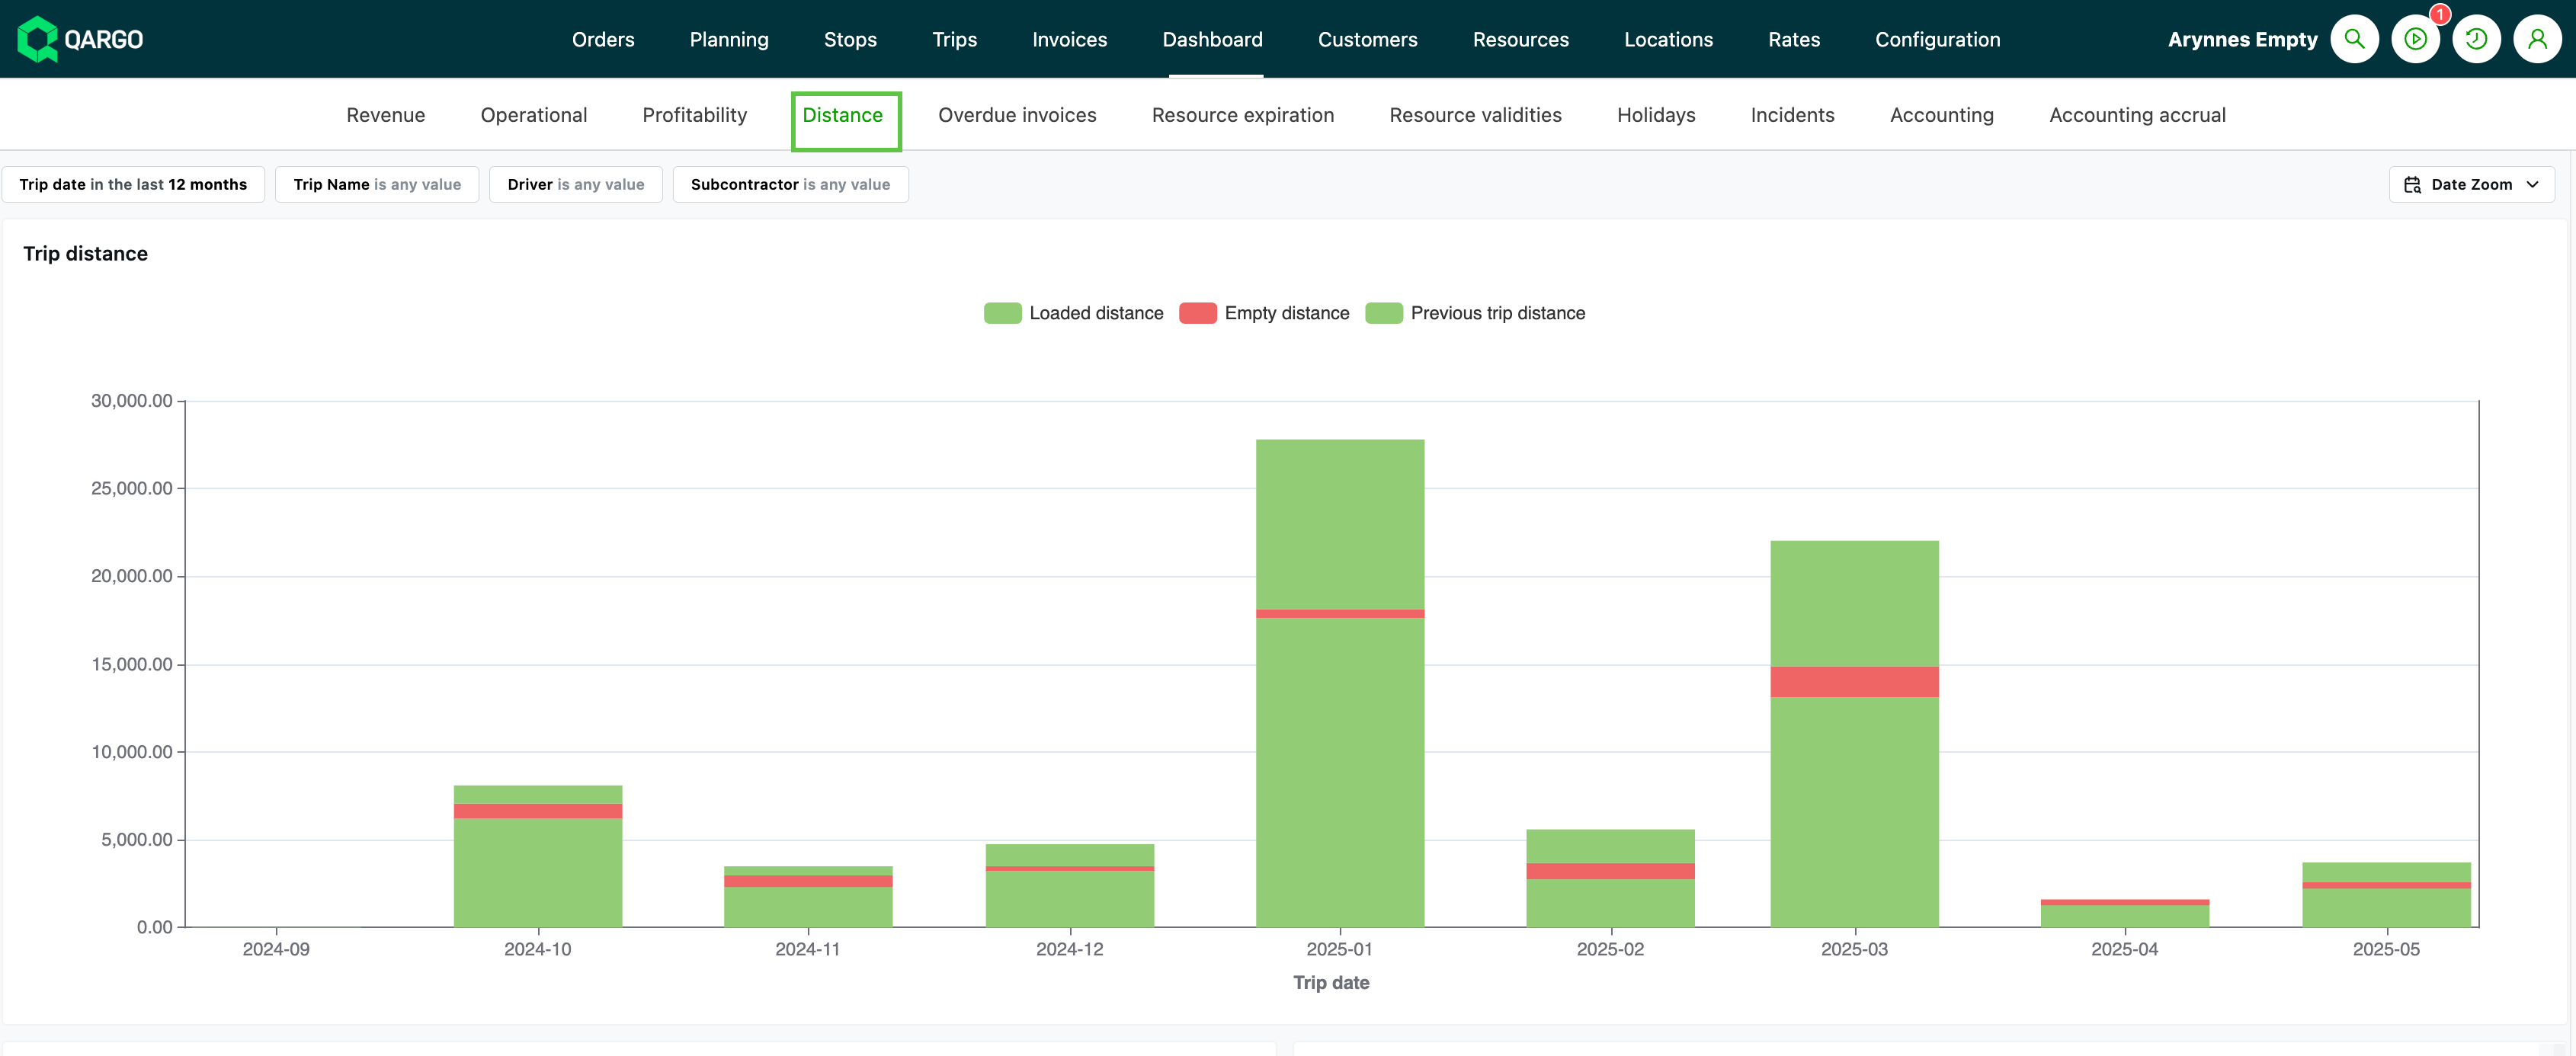
Mileage for loads can be broken down by resource (driver, vehicle, or contract carrier)
- Includes totals and segmented distances (i.e., loaded, empty, deadhead miles)
-
The main source of distance data is the actual driven distance, which can be:
- Pulled automatically from onboard computer/FMS integrations (e.g., Trimble, Transics)
- Entered manually by users in a “Mileage” field on stops or loads
- Estimated using route calculations via mapping providers such as HERE Maps or PTV, if actual data is missing.
-
Distance can also be split per country for reporting, billing, or emissions calculations.
-
Actual driven distance (not just estimated/theoretical distance) is prioritized where available
Summary
Distance data is calculated using the best available source: FMS/integrated mileage, manual entry, or mapping-based estimation. The result is used in dashboards at load, driver, resource, and order level, with support for custom breakdowns, conversions, and accurate cost/emissions calculations.
Overdue invoices
-
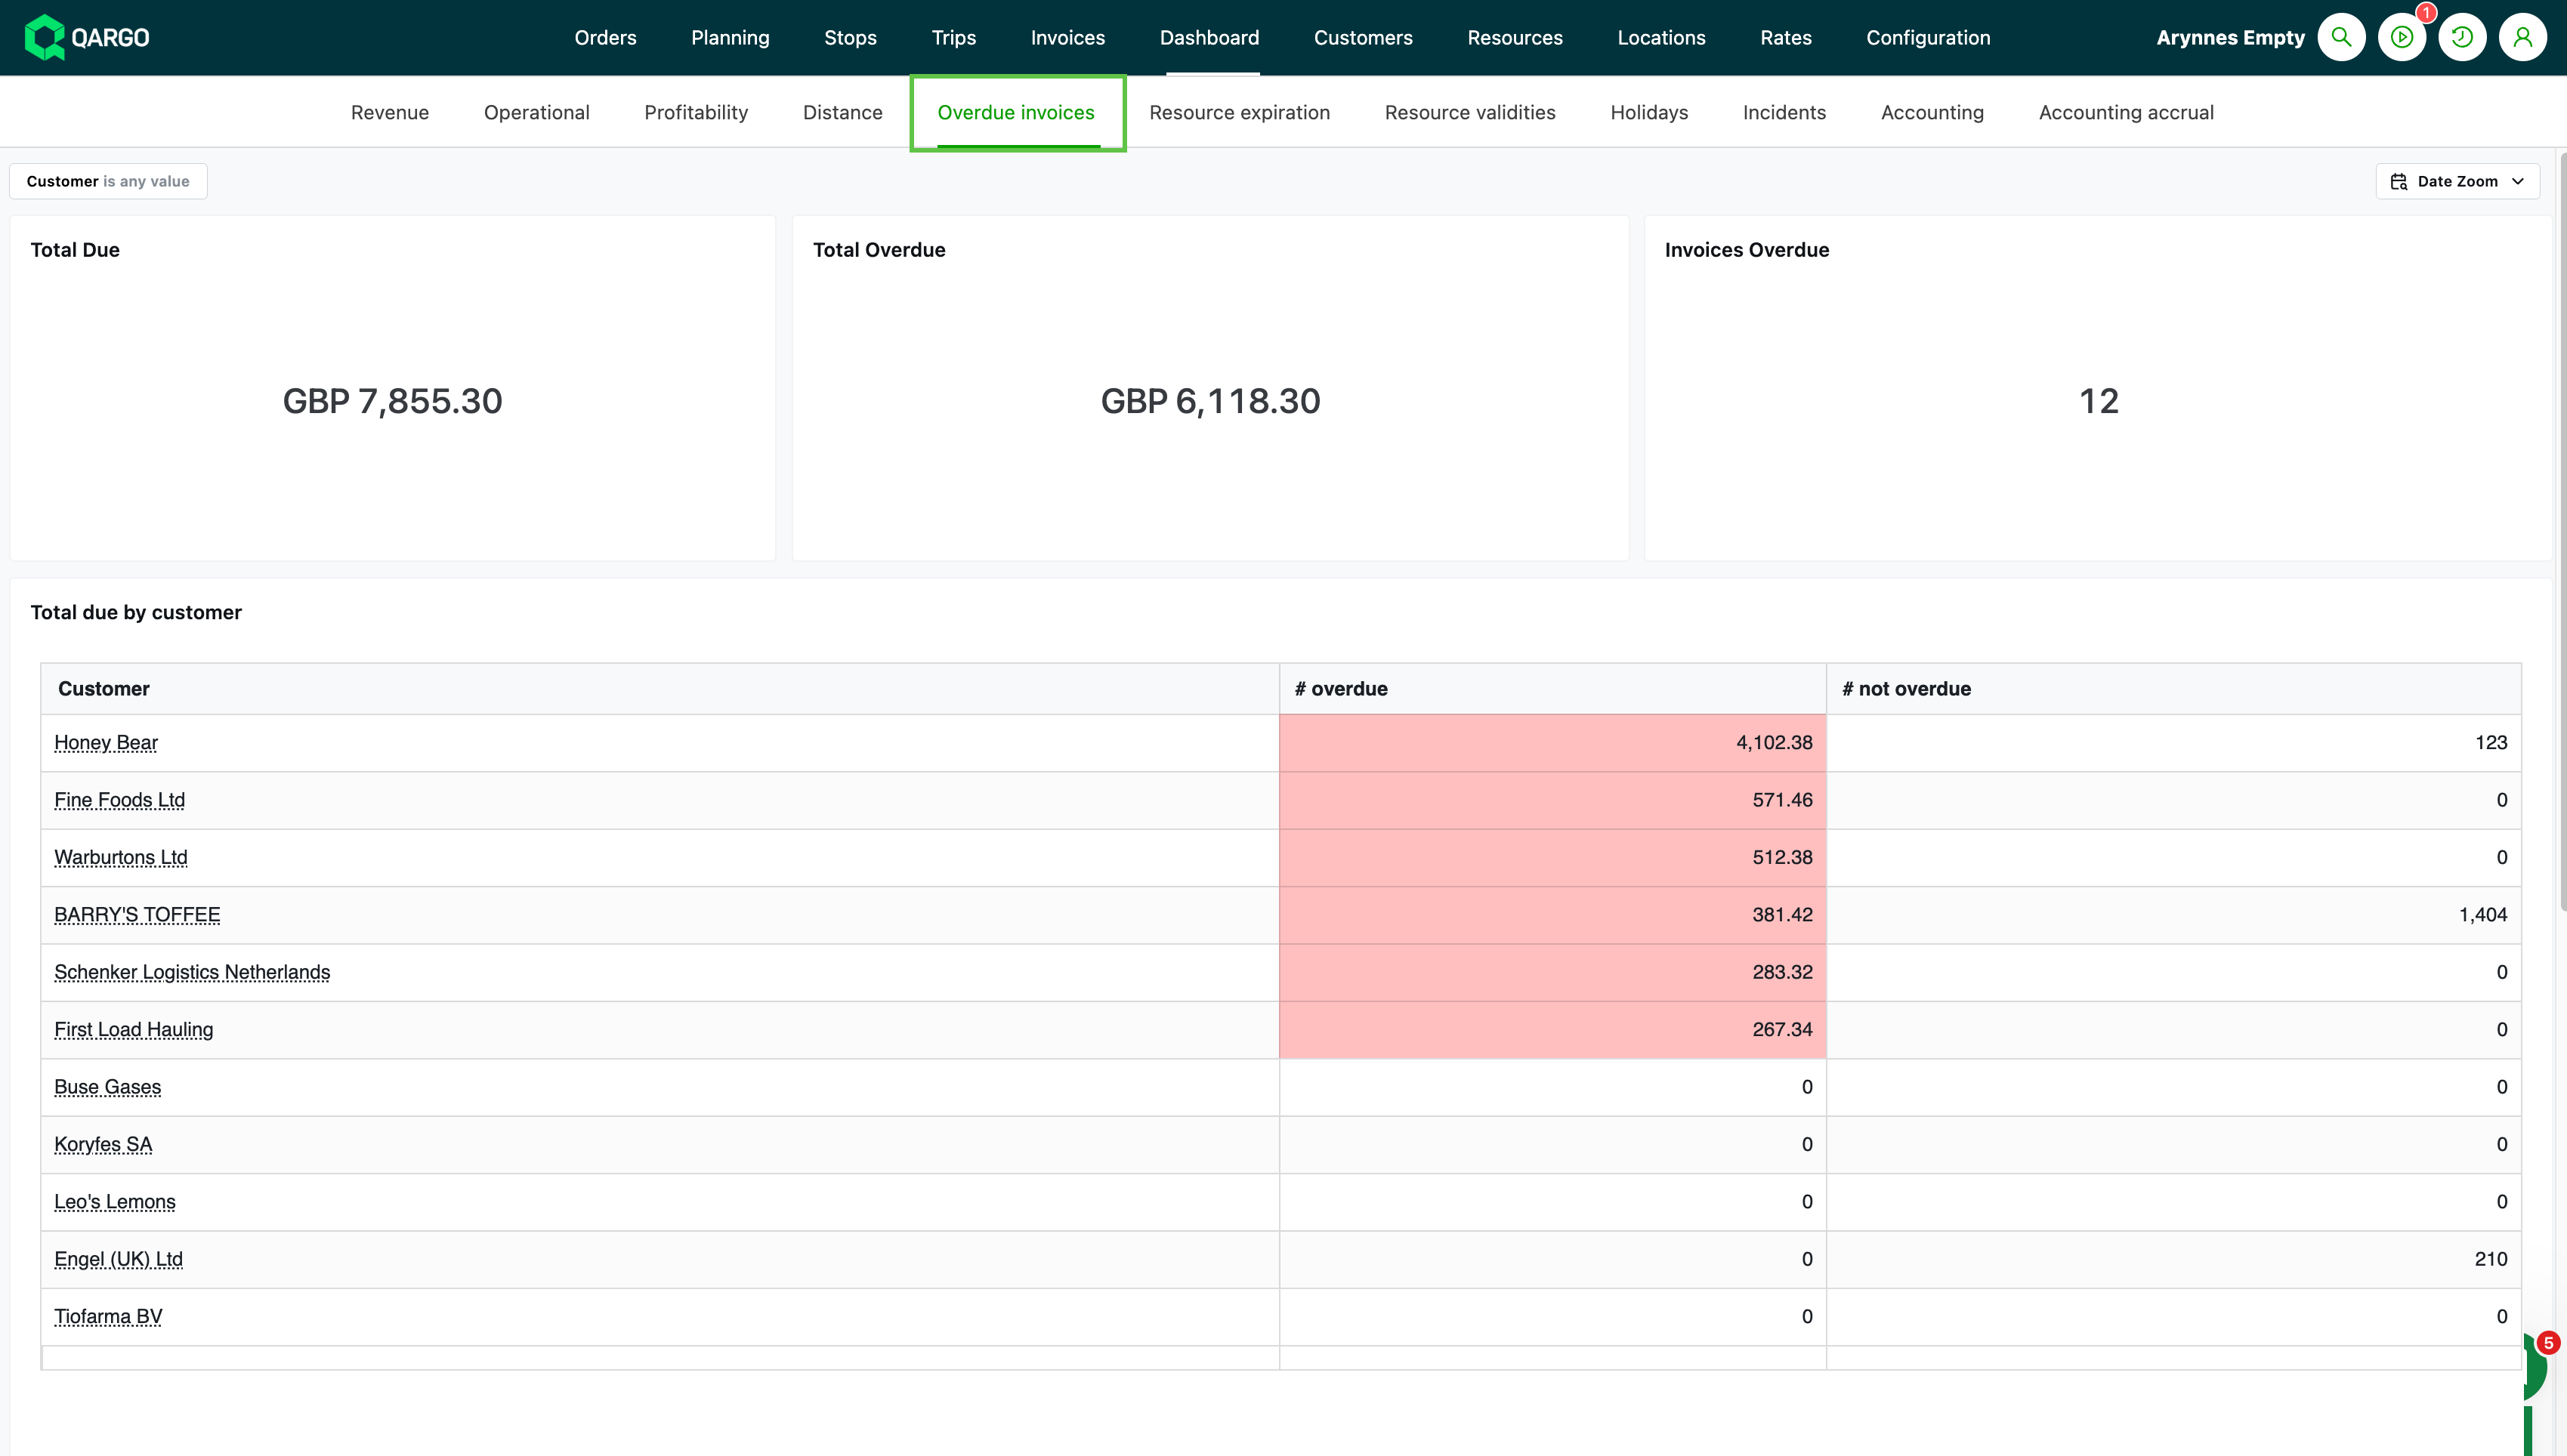
Looks at the invoice associated with the order. Broken down by amount, number, and customer
-
Calculated by looking at the invoices associated with each order.
-
Past due = invoices that are past their due date (i.e., the current date is later than the invoice due date and the invoice is not yet marked as paid).
-
Data is broken down by both the number and the monetary value of overdue invoices
- Can be grouped or filtered by customer for analysis.
- Click the customer link to go to the invoices tab filtered for that customer
Summary
The overdue invoices calculation is driven mainly by comparing the invoice due date with the current date and the payment status, with flexible filtering and grouping to support business decision-making.
Resources
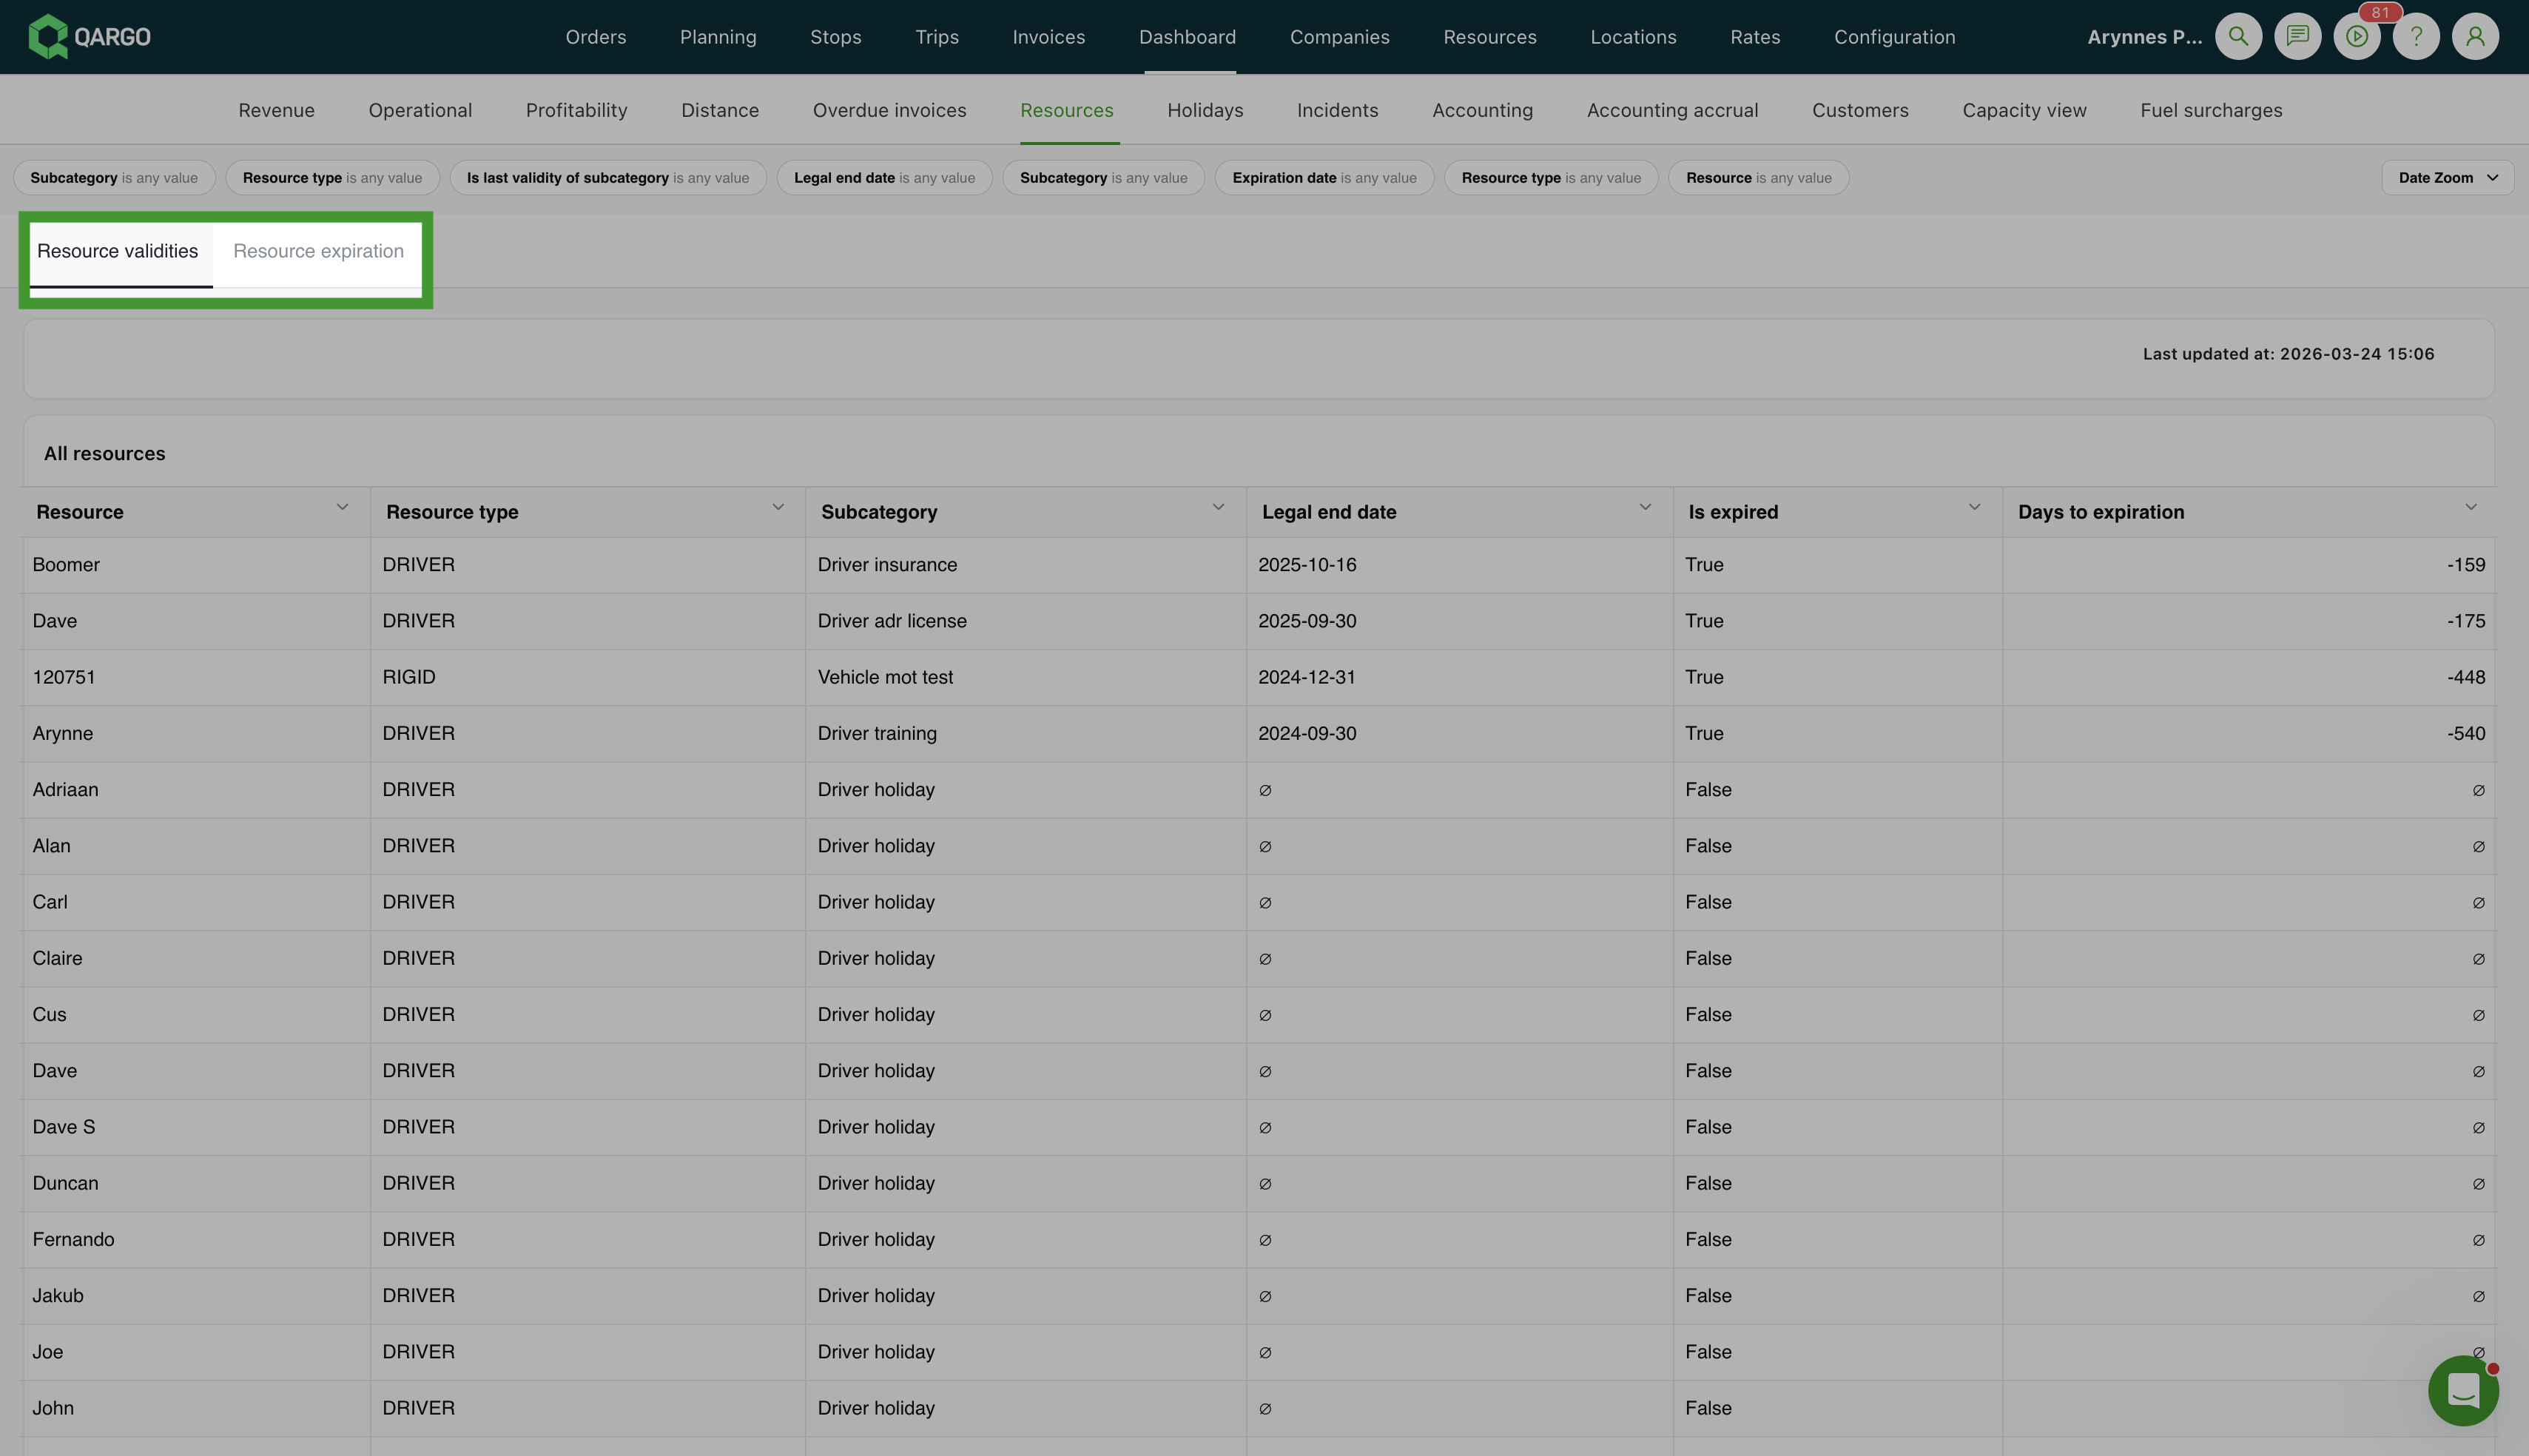
The Resources dashboard has a tab that consolidates two previously separate views into a single tabbed experience:
- Resource validities — shows the validity period for all resources, including start and end dates
- Resource expiration — shows resources with documents or certificates nearing or past their expiration date
Resource expirations
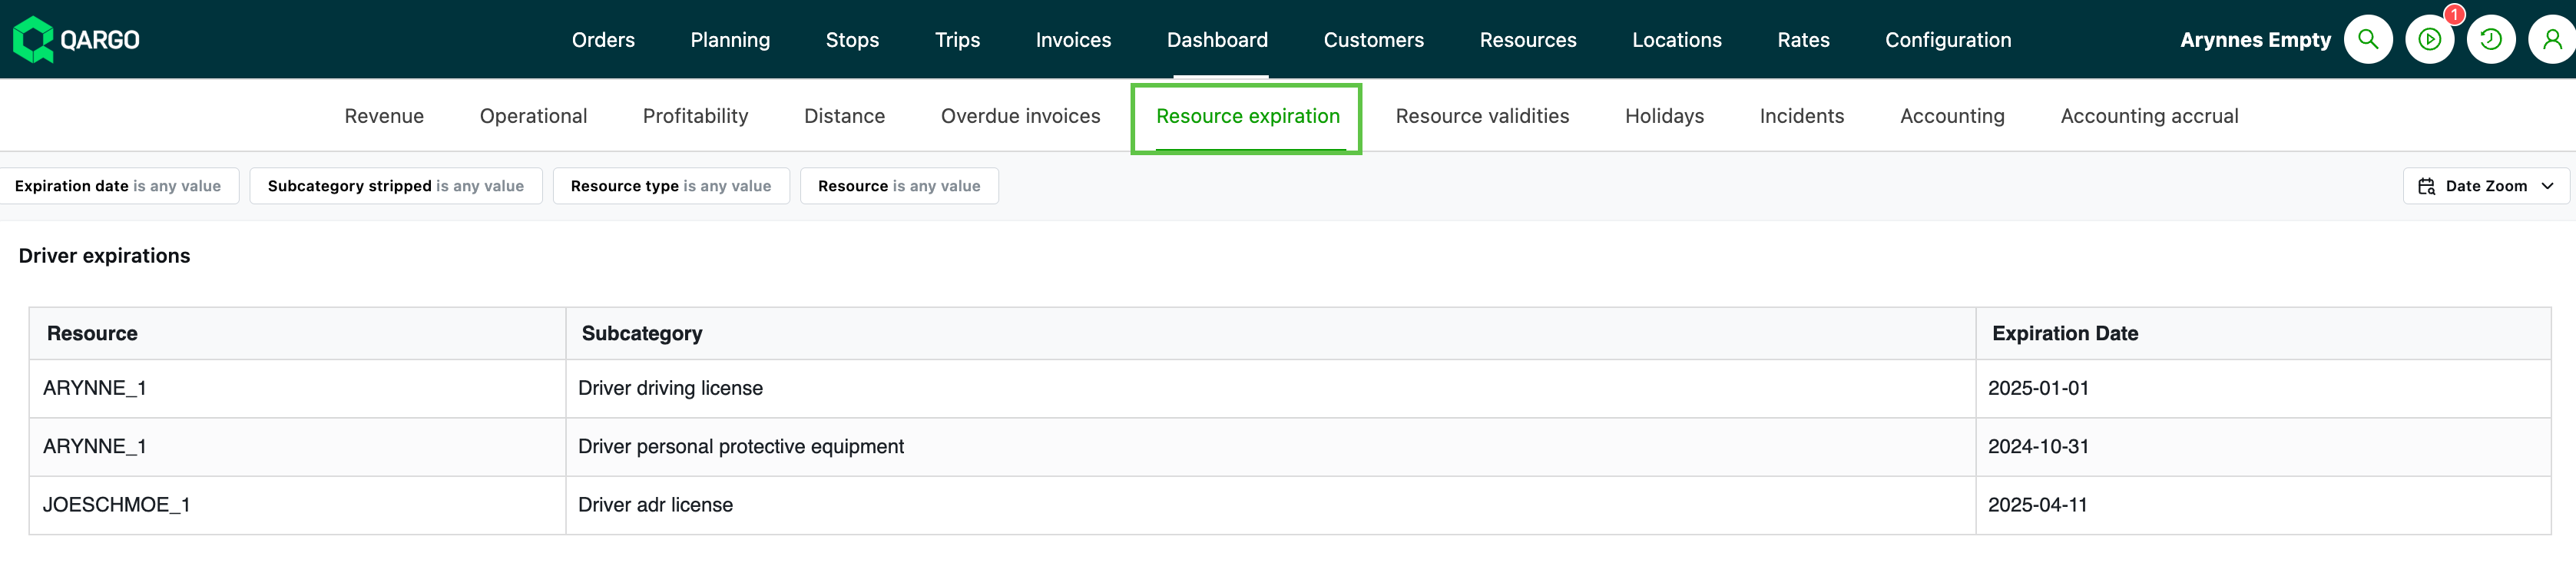
- Looks at specific documents and certificates assigned to resources (especially vehicles and drivers) and reports on the expiration date, i.e., the end of a license or permit.
- Filter on ‘expiration date’ to see when critical documents are due to expire.
- Tables are available for specific resources, i.e., driver-related expirations.
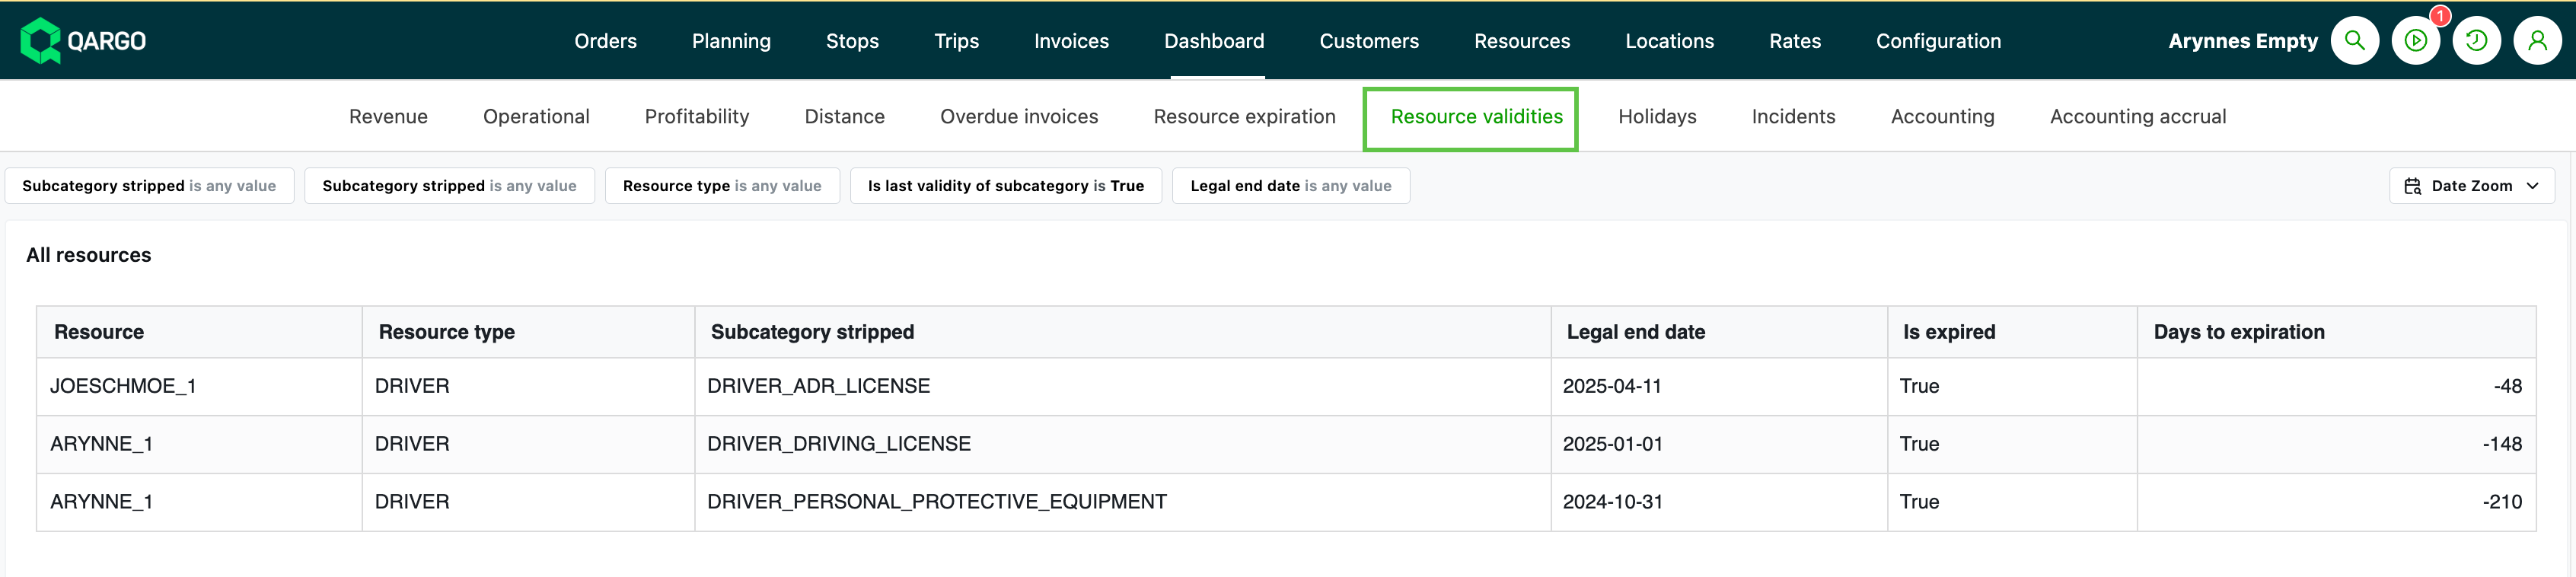
Resource validities
-
Reports on the validity period for all resources, including start and end date / expiration and number of days until expiration.
-
Includes resources that are currently unavailable due to expired validities.
-
Filter on ‘End timestamp’ or ‘legal end date’ to view resources with dynamic unavailability
- The system automatically marks a resource as unavailable when a document expires.
Why 2 options?
The split between the Expiration and Validity dashboards is mainly due to:
- Customer workflow: flexibility to see all validities vs. just upcoming expirations.
- Filtering: Resource expiration typically uses an “is between” expiration date filter, while Resource validity dashboards use filters on the legal end date.
Summary
- Use Resource Expiration for a quick, focused list of items that are about to expire soon (with direct date-based filtering).
- Use Resource Validity to see the full range of validity periods for resources (including those that have already expired or cause current unavailability).
Holidays
-
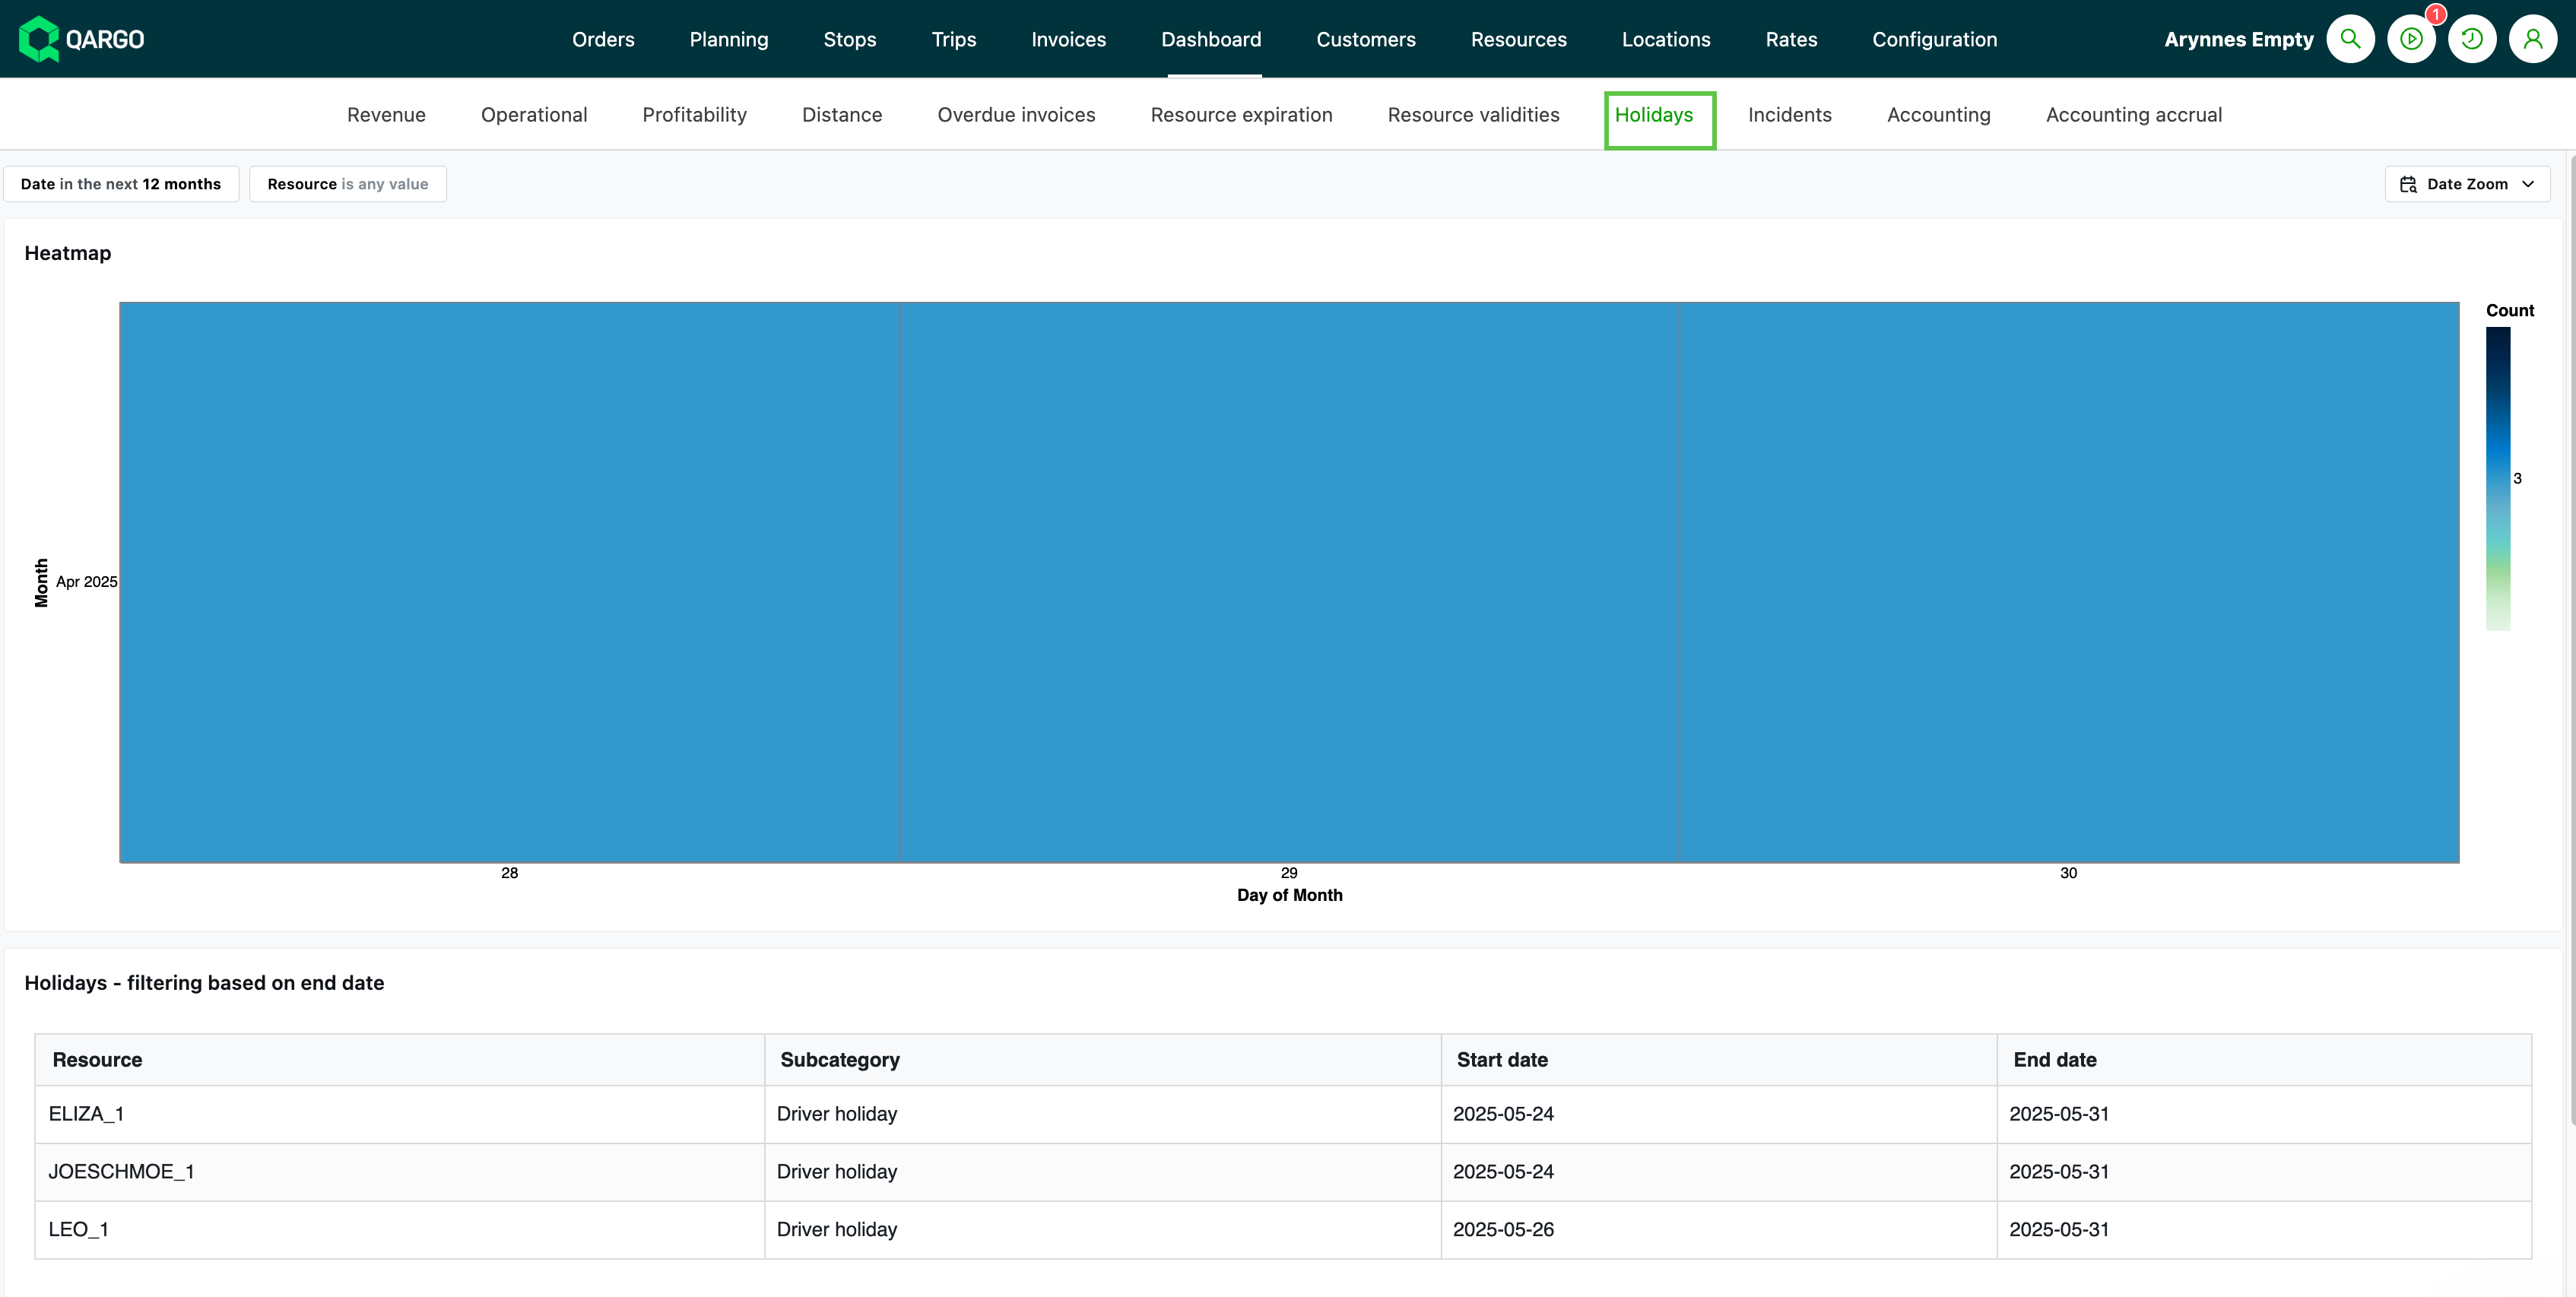
Based on ‘Resource Unavailability’ records (mostly drivers) entered for holidays or time off
-
Export features allow retrieval of exact holiday dates per driver/resource
-
Uses the holiday start / end date to determine ‘Active’ status
- Filtering is based on the end date; this may not return all holidays active on a specific date, i.e., holidays still ongoing after the specified end date are not included
Summary
Holiday dashboards aggregate and display driver/resource time-off periods, with data based on the start/end dates of holiday records. Use them for planning, reporting, and filtering resource availability, so that staffing issues or driver shortages can be managed proactively.
Incidents
-
Based on incident records linked to orders, stops, and goods (freight).
-
All incident types are included; both “stop-level” and “goods-level” incidents are counted and displayed together.
-
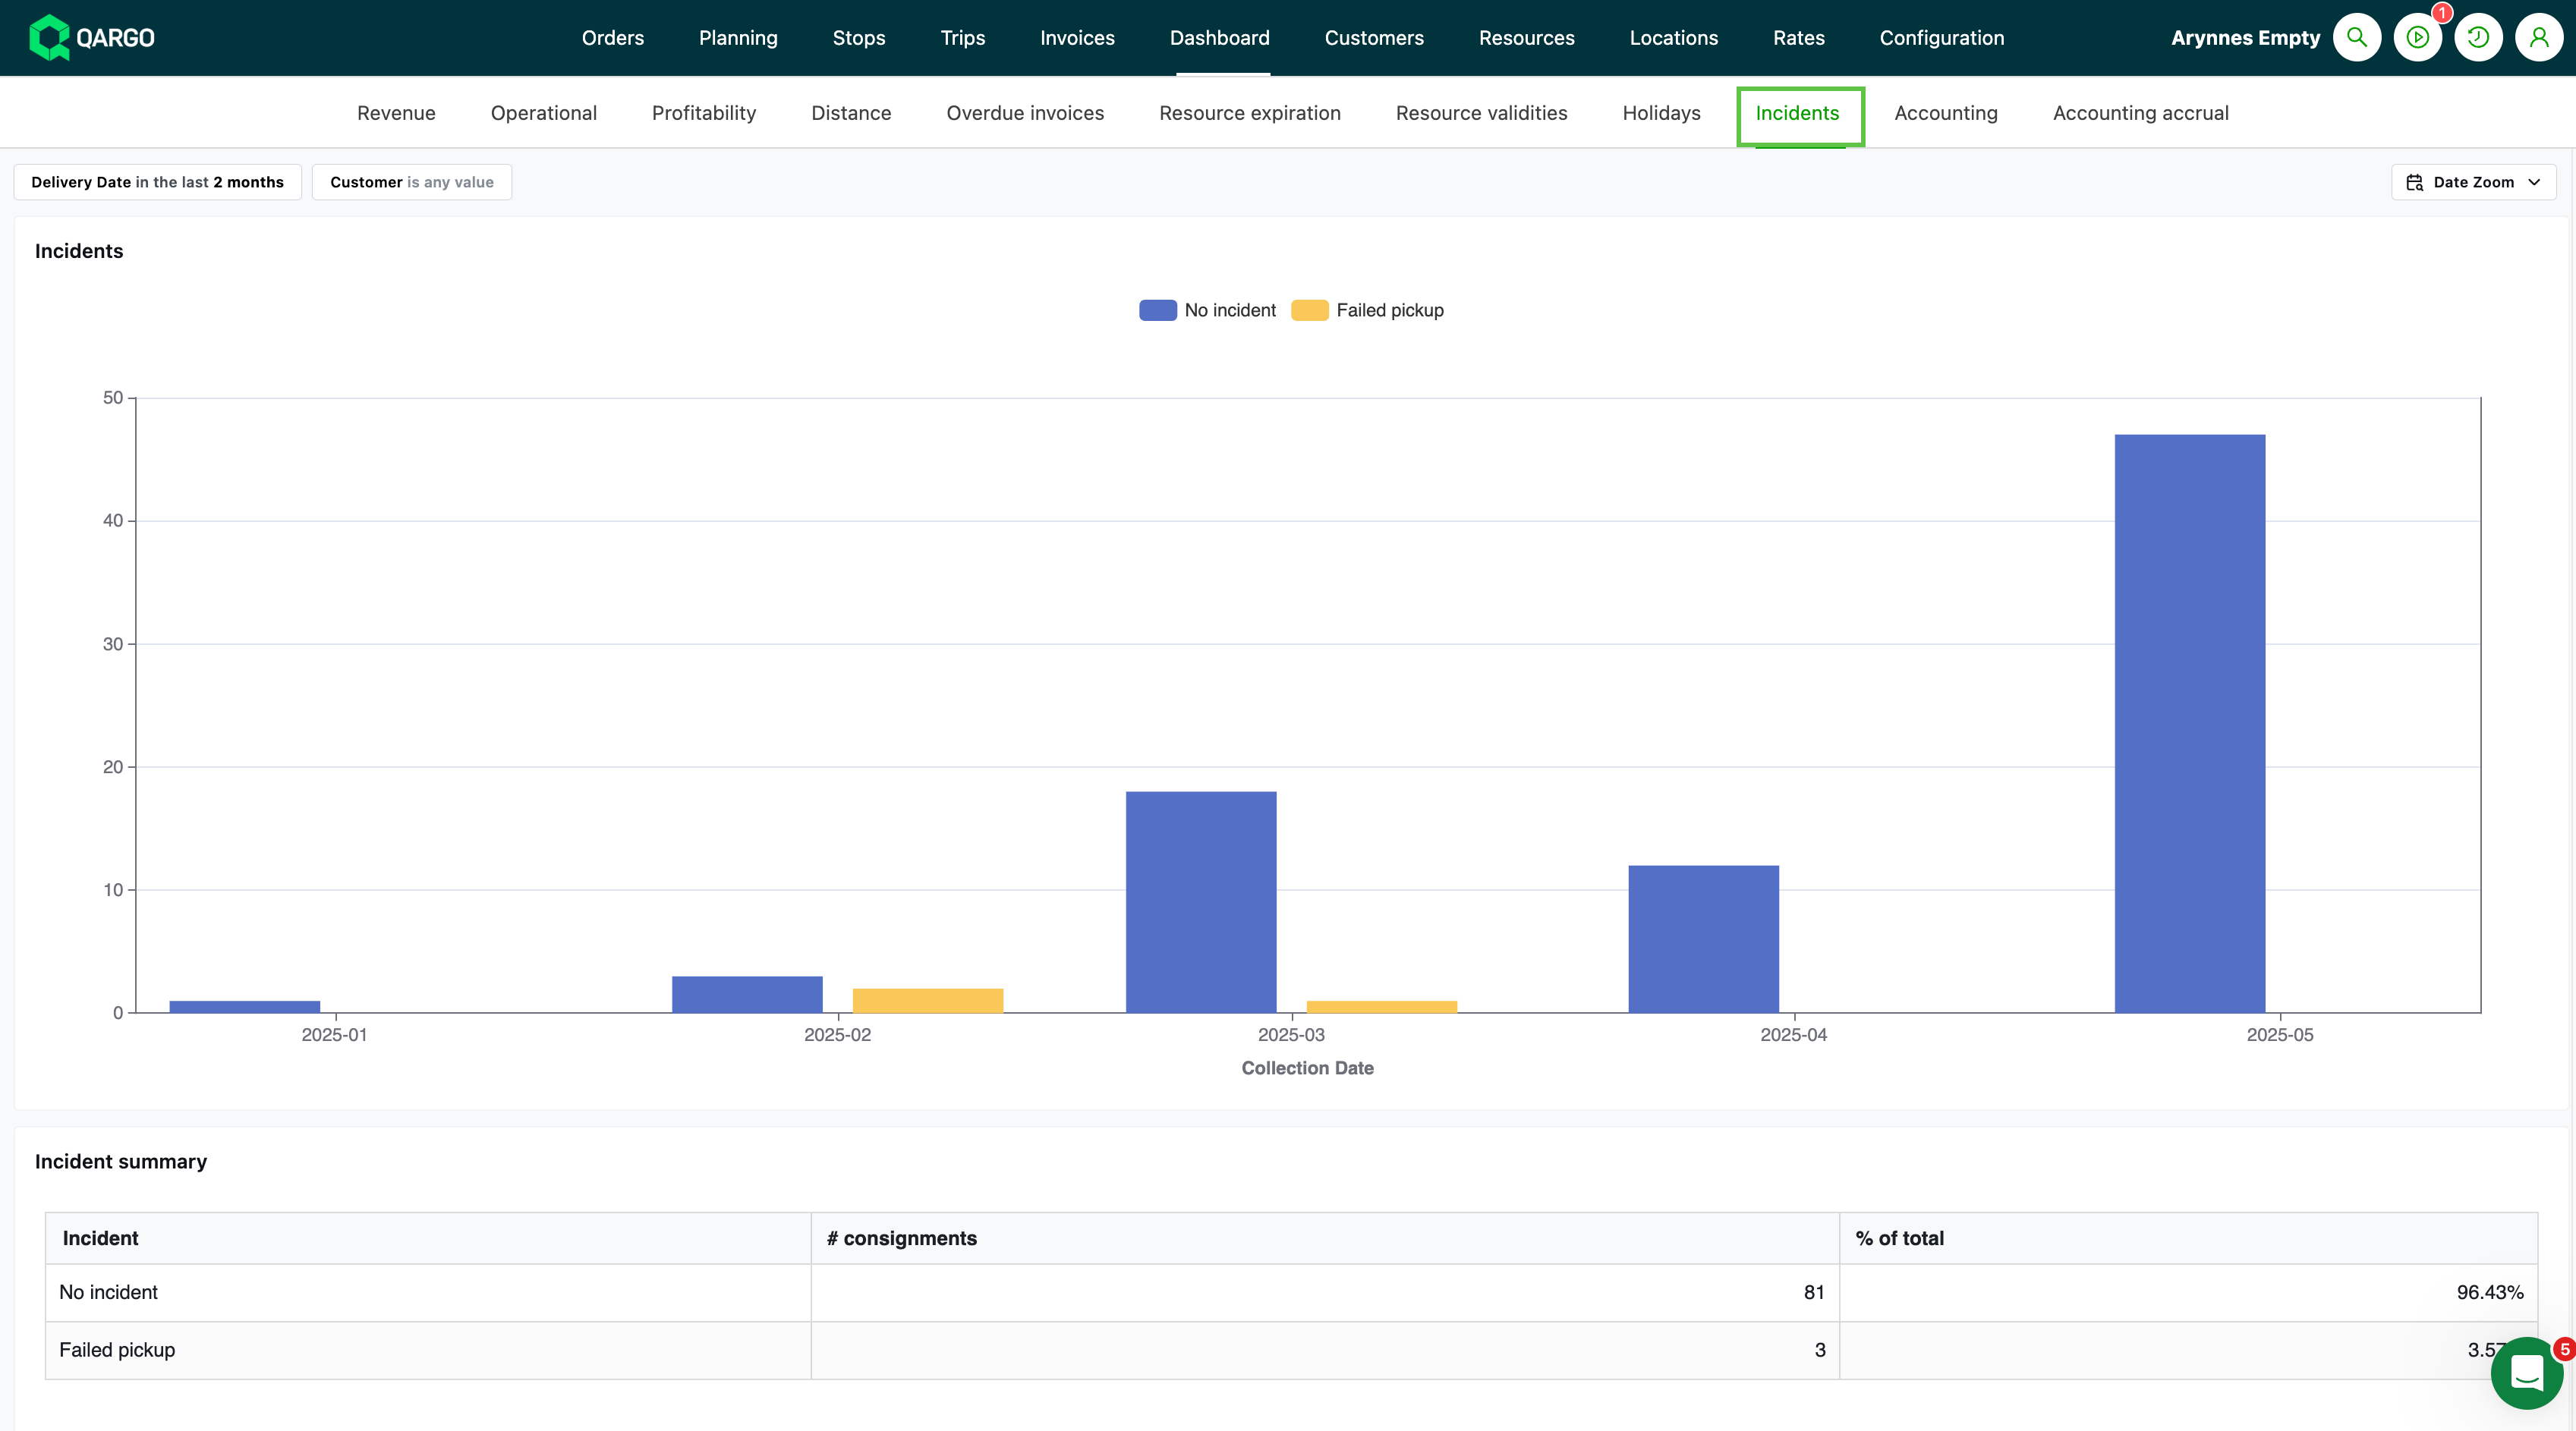
The main incidents dashboard offers:
-
A summary table grouping all orders by incident type (i.e., failed delivery), including a “No incident” or “Clean delivery” row for incident-free shipments.
-
Clicking an incident type reveals all affected orders, with columns such as Order ID, Customer, Service level, Revenue, and Cost, and click-through to order details.
-
For each incident type, includes:
- orders
- loading meters
- pallet spaces
- percentage of the total.
-
-
If a single shipment (order) has multiple incidents, each incident is counted / “No incident” means the order was carried out without any logged incident.
-
On Time, In Full (OTIF) standards track the percentage of orders delivered without incidents and categorize all types of failures, not just late or missing deliveries.
Summary
Incidents are calculated based on structured records of failures/issues logged at stops or on freight. The dashboard aggregates these per incident type, customer, or time period, and allows a detailed drill-down for review and improvement actions.
Accounting
-
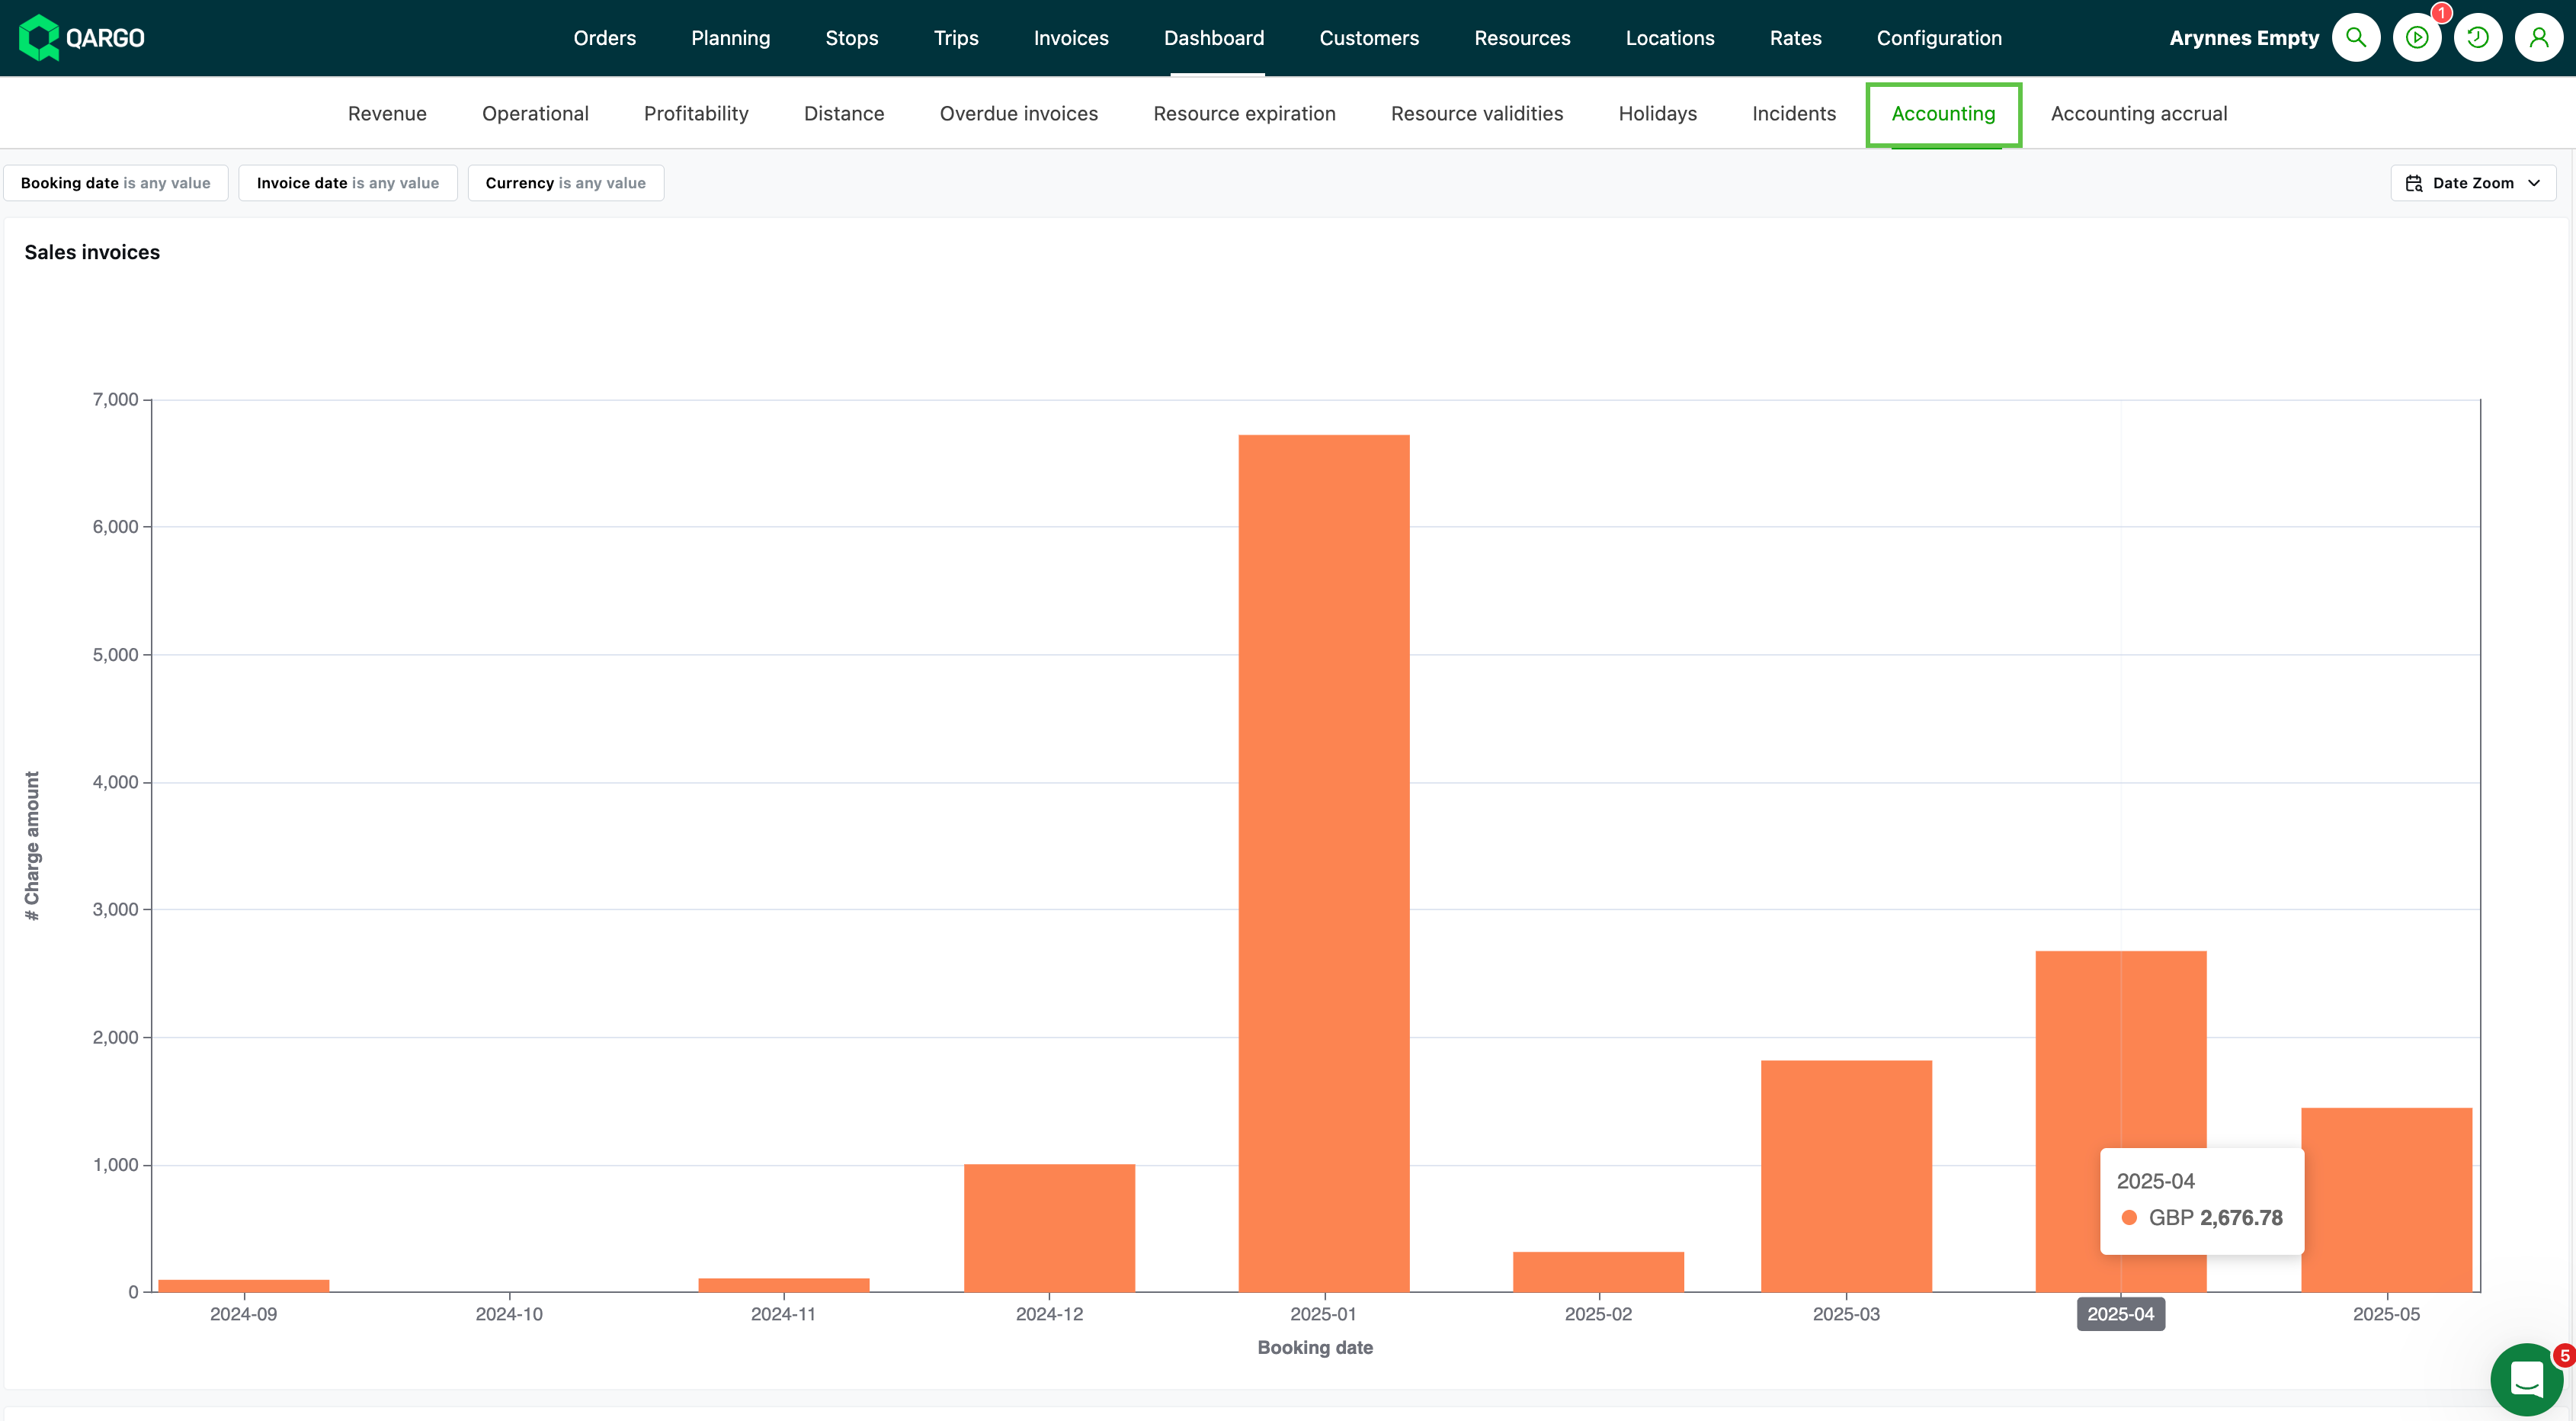
Accounting data is based on sales and carrier invoices, credit memos, and accruals.
- Mirrors what is sent or booked in the accounting package, supporting reconciliation and transparency
-
Tables are based on individual invoice line items across:
- Sales invoices
- Credit memos
- Carrier invoices
-
Credit memo tables allow tracking of reversals, corrections, or cancellations
-
Carrier invoices include costs from suppliers or contract carriers
-
A breakdown by contract carrier vs. company fleet is available
-
Accounting dimensions = custom fields for analytical and financial reporting at line item level, for accounting data entry.
- Up to 3 accounting dimensions available, mapped to internal categories such as department, cost center, project code, etc.
- Description field available for each line
- Shown on both the invoice detail page and in exported data, so customers can check and validate transaction classifications
- Configured per customer so that the fields / descriptions shown match what is needed for group reporting / accounting exports
Summary
The accounting data is calculated by aggregating actual and accrued sales/carrier invoices and credit memos at charge line level, split by operational type and filtered by invoice/accrual date. This makes it possible to verify what has been sent to accounting and what is still pending, and to perform period-end reconciliation and reporting.
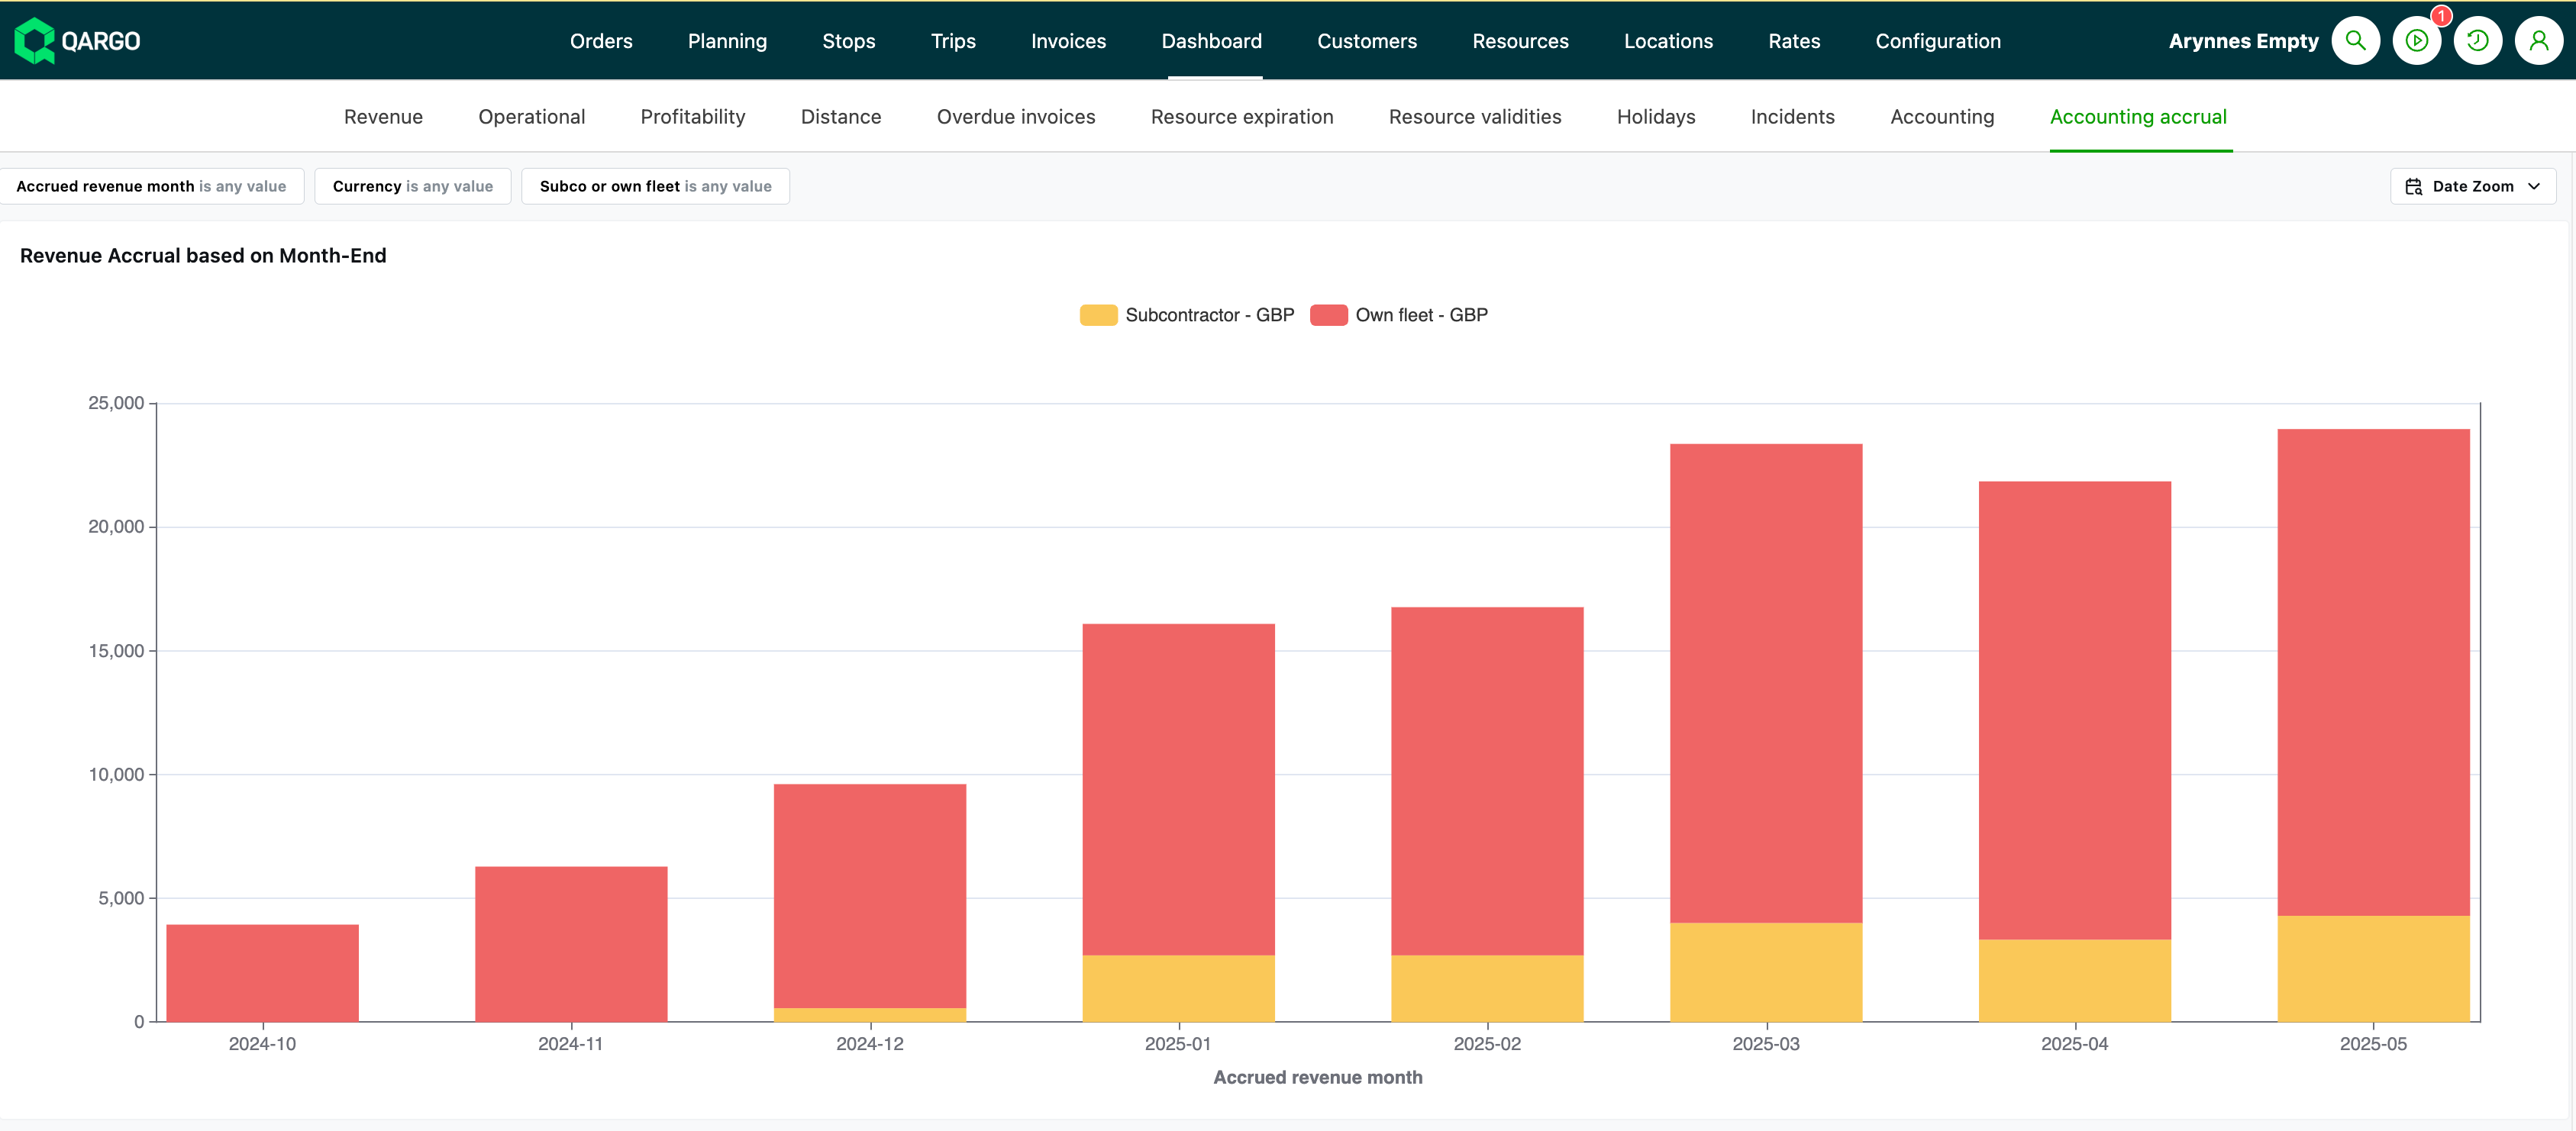
Accounting accruals
-
Allows accurate period-end cut-offs, supporting month-end closing, interim reporting, and reconciliation with accounting software.
-
Accruals account for revenue or cost that has occurred but has not yet been invoiced / booked
-
Calculated at charge level from completed orders; enables estimation of revenue earned but not yet realized on invoices
-
Revenue accruals:
- All charge lines (not the whole order total) are considered
- Sums up charges where the service has been delivered/carried out (using “pickup date,” “delivery date,” or a configurable “charge date”) but has not yet been invoiced as of the selected accrual date
- If part of an order is on an invoice and part is not, only the uninvoiced charges are counted in the accrual.
- The “Revenue accrual orders” section displays orders that have not yet been invoiced, including their current status. The date filter can be adjusted to view billing periods, making it easier to monitor revenue accruals and ensure timely billing.
-
For cost accruals (carrier invoices):
- The total value of completed services (loads/shipments) not yet booked in a carrier invoice as of the accrual date is included
- This is calculated for each cost charge item, often grouped by company fleet vs. contract carrier, shipment, supplier, etc.
- The accrual is always based on a cut-off/accrual date (typically the end of the accounting month).
- Charges already locked for prior periods cannot be modified, ensuring data integrity for closed accounting periods
Summary
Accounting accrual data is the sum of revenue and/or cost charges that have been completed but not yet invoiced (for revenue) or received/booked (for cost) as of a specific cut-off date. This calculation happens at the individual charge instance level for precision and auditing.
Customer
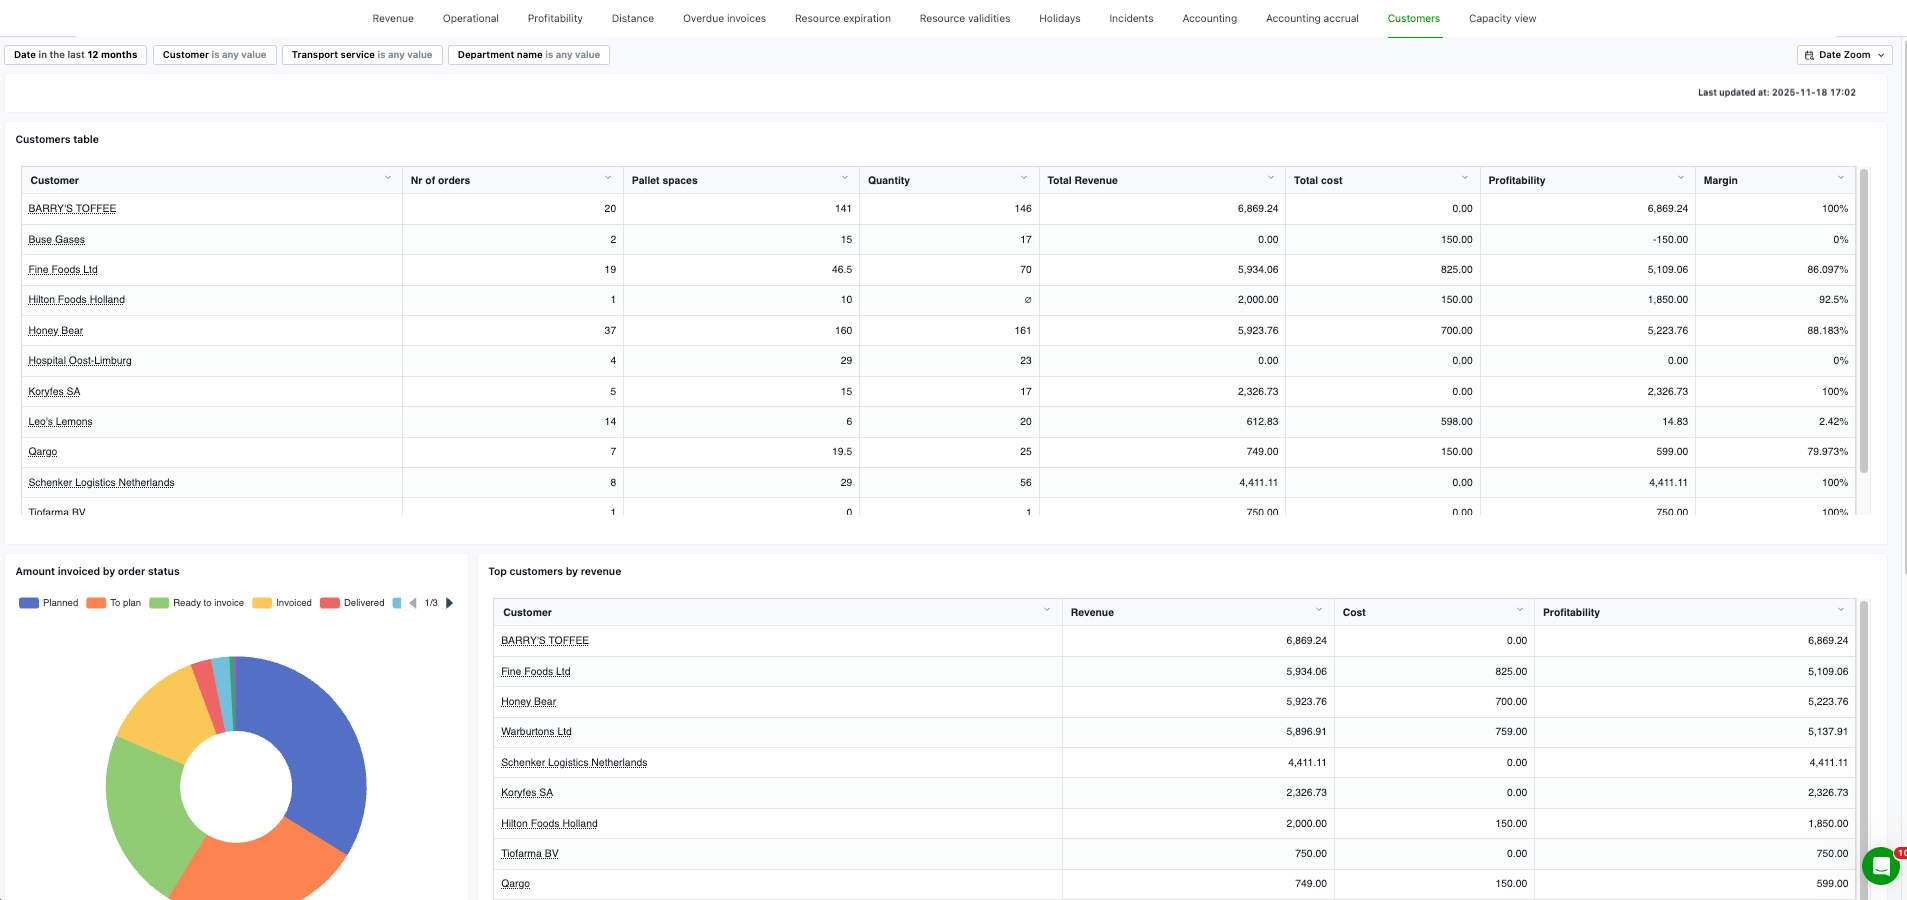
-
Gives a customer-centric view of operational and financial performance, with drill-downs and quick links back into Qargo.
- Customers table
- Amount invoiced by order status
- Top customers by revenue
- Top customers by order volume
- Inactive customers in the last 60 days
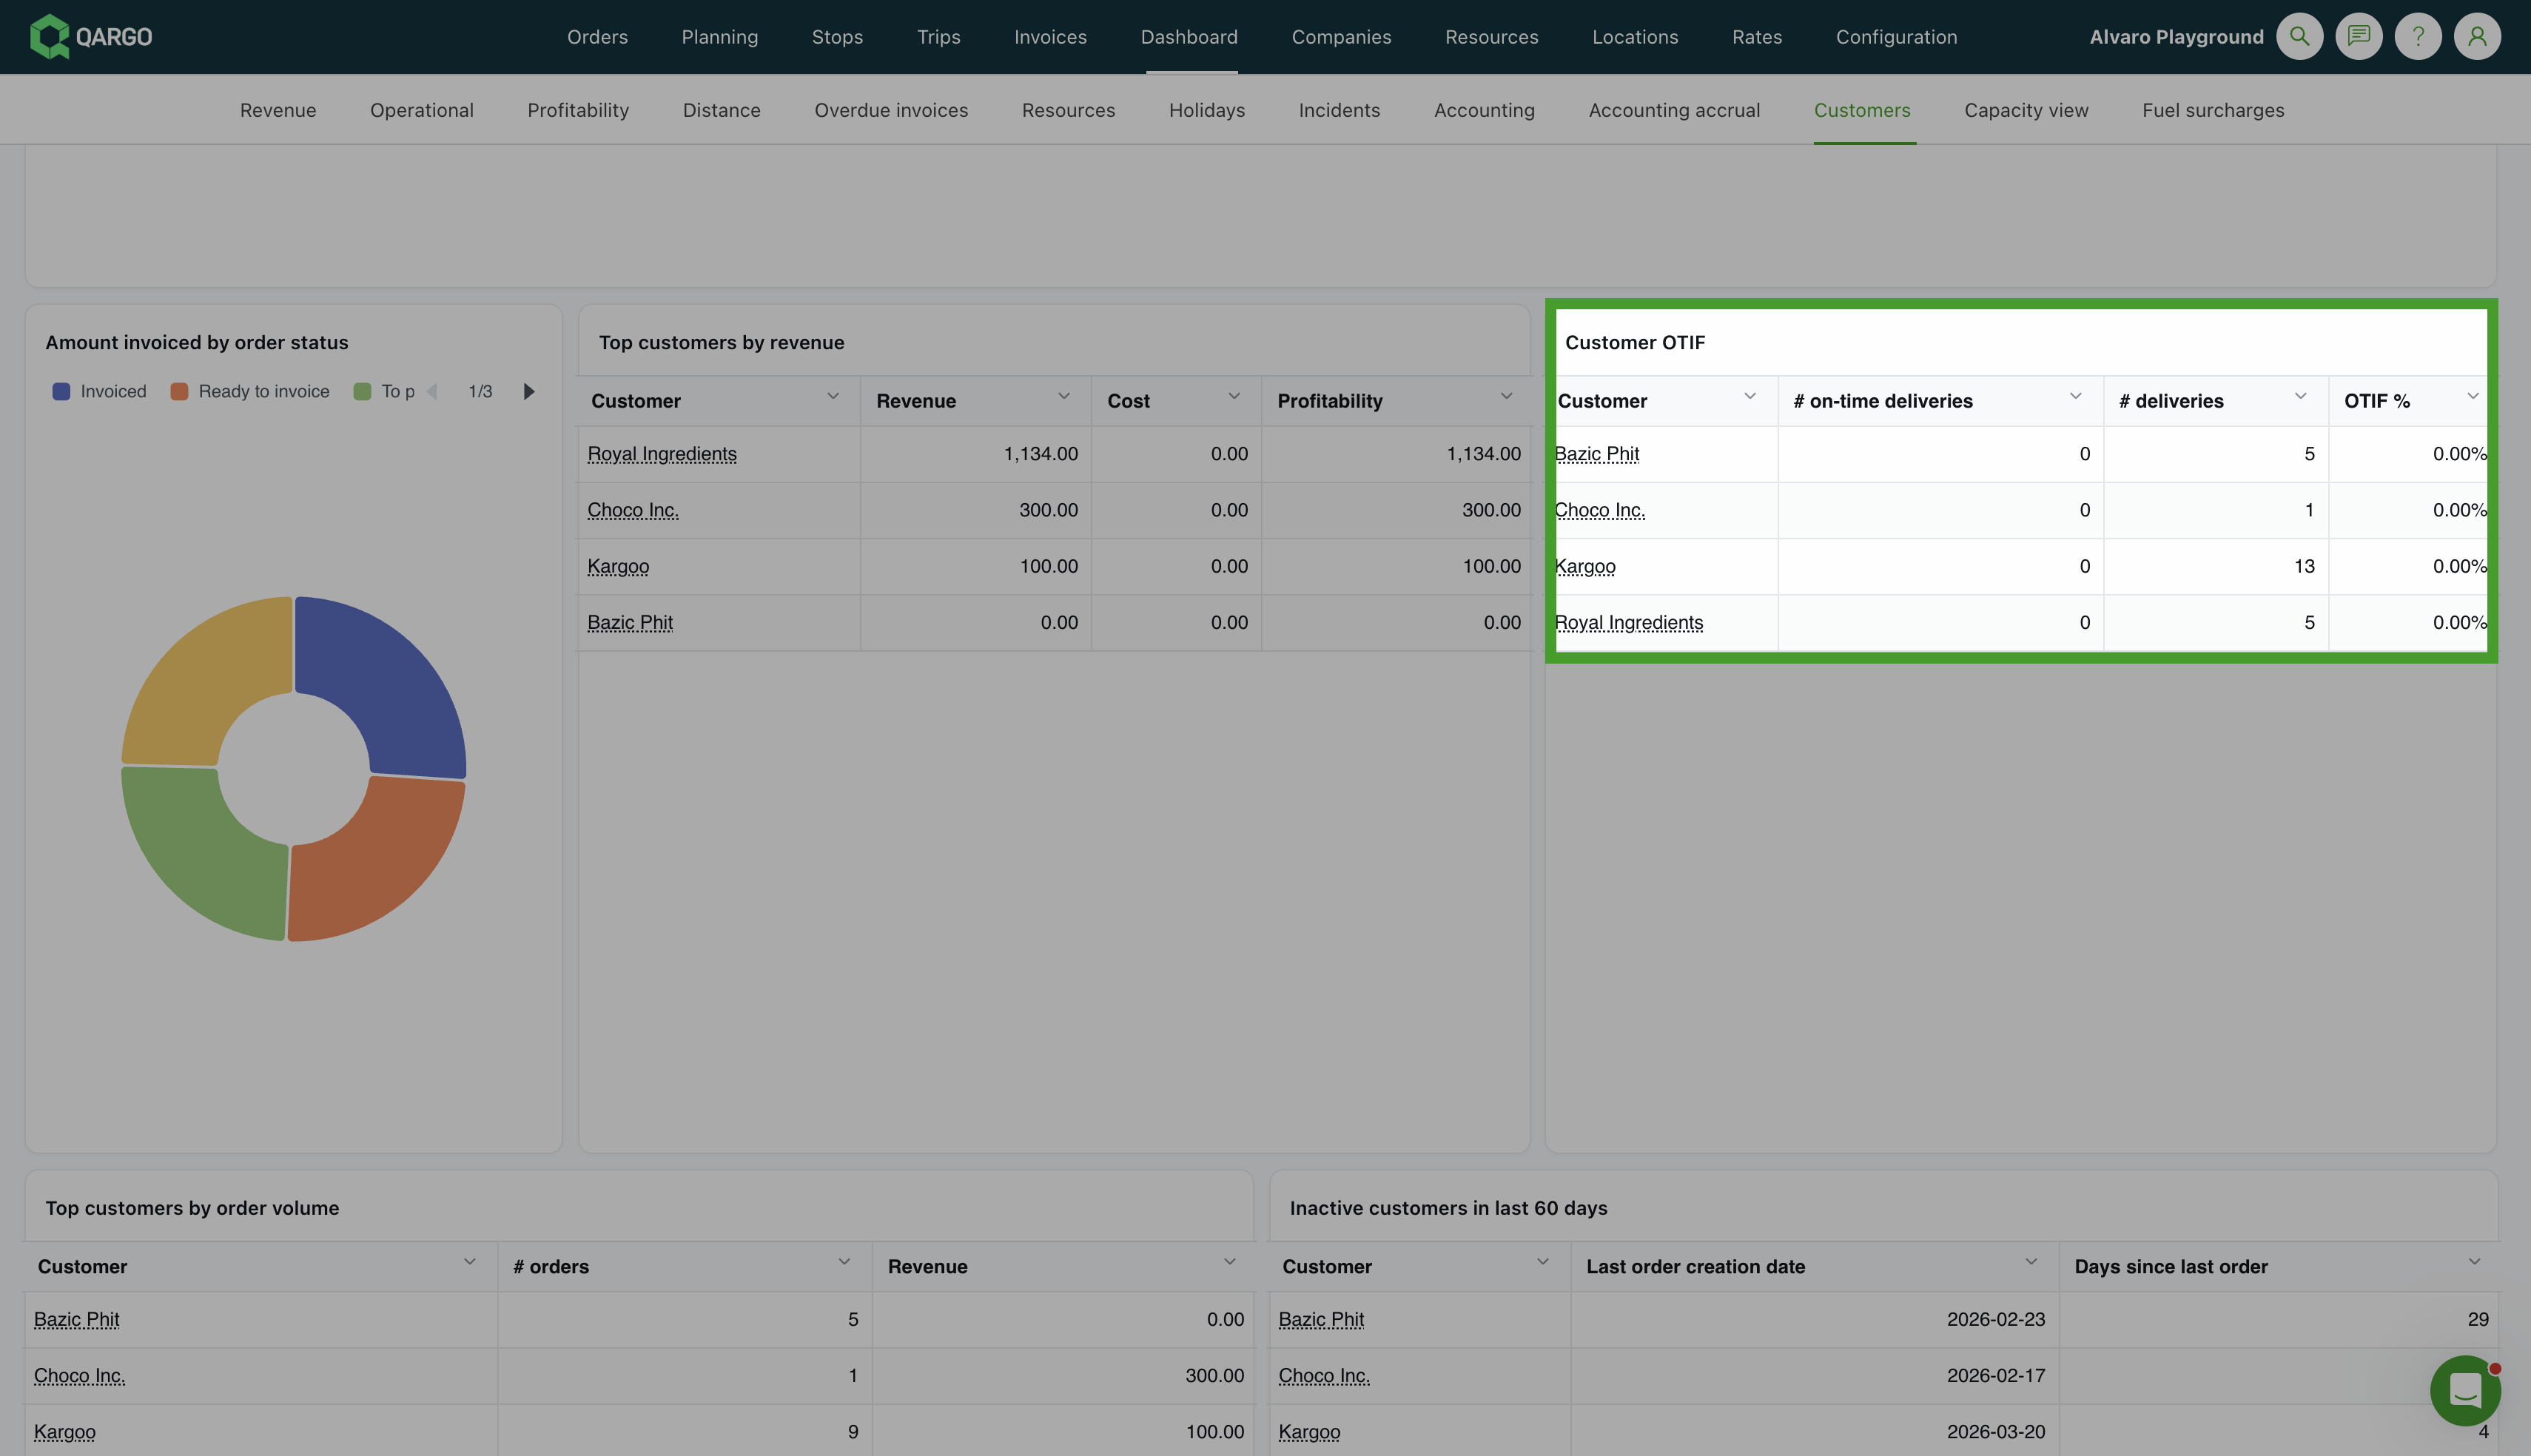
OTIF table
The Customer OTIF table shows the on-time delivery percentage per customer, giving a quick view of delivery performance by account.
Summary
See key metrics for all customers (number of orders, revenue, costs, margin, etc.), or filter on one or more customers to focus the charts and tables on a specific account. Click through customers, orders, loads, or invoices to open the exact record in Qargo, or jump to the relevant list view, pre-filtered by that customer. Use the 3-dot menu to export any chart or table as a CSV or image file.
Transport/pallet network
-
Network-focused operational view designed to surface KPIs and bottlenecks for pallet network work
-
Live service KPIs for jobs, alongside volumes and status breakdowns in a ‘service board’ style view
- The emphasis is on ‘same-day visibility and alerts’
-
Drill down from charts or tables into exact orders, loads, or invoices and open records directly in Qargo
-
Filter to drill into more detail over different date ranges
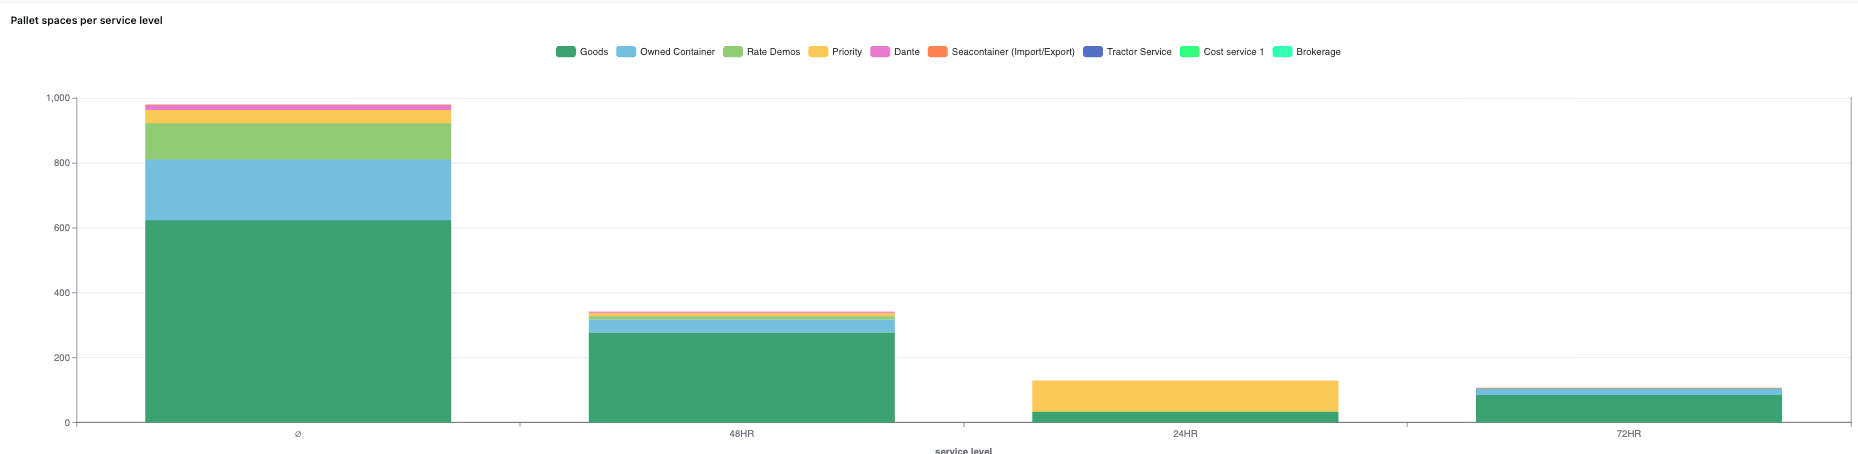
Two new charts have been added to the Transport / Pallet Network dashboard:
- Total pallet spaces per transportation service over time — shows pallet space volume trends for each transportation service
- Total packaging quantities per transportation service over time — shows packaging quantity trends per service
Summary
A network-focused operational dashboard that provides real-time visibility into pallet network performance, highlighting key KPIs and potential bottlenecks. The platform emphasizes same-day visibility, allowing drill-down from charts and tables into specific orders, loads, or invoices, with direct access to open records in Qargo. Flexible filtering enables detailed analysis across custom date ranges for proactive operational management.
Capacity
The Capacity dashboard provides a daily overview of operational activity in several tables, focusing on order volumes, pallet space usage, transportation metrics, and driver availability. This gives operations teams an overview of their workload distribution, helps identify capacity constraints, and supports informed planning decisions.
-
Direct:
- When the pickup and delivery stops of a shipment are assigned to the same load, they are displayed under the Direct column (+1).
- The count is shown on the pickup date.
-
Pickup / Delivery:
When pickup and delivery occur on different loads, they are shown separately under the Pickup and Deliver columns (each counted once).- Pickup = Assigned according to the pickup date
- Delivery = Assigned according to the delivery date
-
Total orders
- Displays the total count of orders for each specific date.
-
Pallet spaces/loading meters/weight
-
The count is shown per day:
- pickup/delivery/direct pallet spaces
- pickup/delivery/direct weight
- pickup/delivery/direct loading meters
- ADR loading meters: if part of the shipment contains ADR goods, all goods on the shipment are counted as ADR.
-
-
Planning groups
- Breaks down pallet space utilization per planning group, providing insight into resource allocation across different operational teams.
-
ADR shipments
- If a shipment includes both ADR and non-ADR freight, all goods are classified as ADR. For example, if 10 pallets are shipped and only 5 contain ADR goods, all 10 are shown as ADR.
-
Container imports / exports
- These figures represent total container activity by order and are not included in the pickup, delivery, or direct totals.
-
Driver availability
- Driver capacity is shown based on absences due to holidays or sickness. This measure reflects potential availability only and does not account for current dispatch or assignment status.
Summary
The Capacity dashboard provides a daily snapshot of operations, showing total orders, pallet spaces, loading meters, weight, container activity, ADR shipments, and driver availability. It distinguishes between Pickup, Deliver, and Direct movements based on whether shipment pickup and delivery occur on the same or different dates. Container imports/exports are tracked separately, ADR shipments count all freight if any ADR items are present, and driver availability reflects absences due to holidays or sickness without considering dispatch status.