
Dashboards: viewing data.
Dashboards provide data visualization across revenue, operations, profitability, and more. Includes filters, export options, and clickable links.
Table of contents
Each time an order, a load, or an invoice is created in the platform, valuable information is entered. The Dashboard module provides an easily accessible overview of that data, from revenue to costs, the due date of invoices to be paid, etc.
Configuration
-
Navigate to Configuration > Organization settings
-
From the Tenant submenu on the left, select Finance and profitability
-
Locate Charge date in dashboards and select the preferred option from the dropdown:
- Pickup date
- Delivery date
-
Click Save
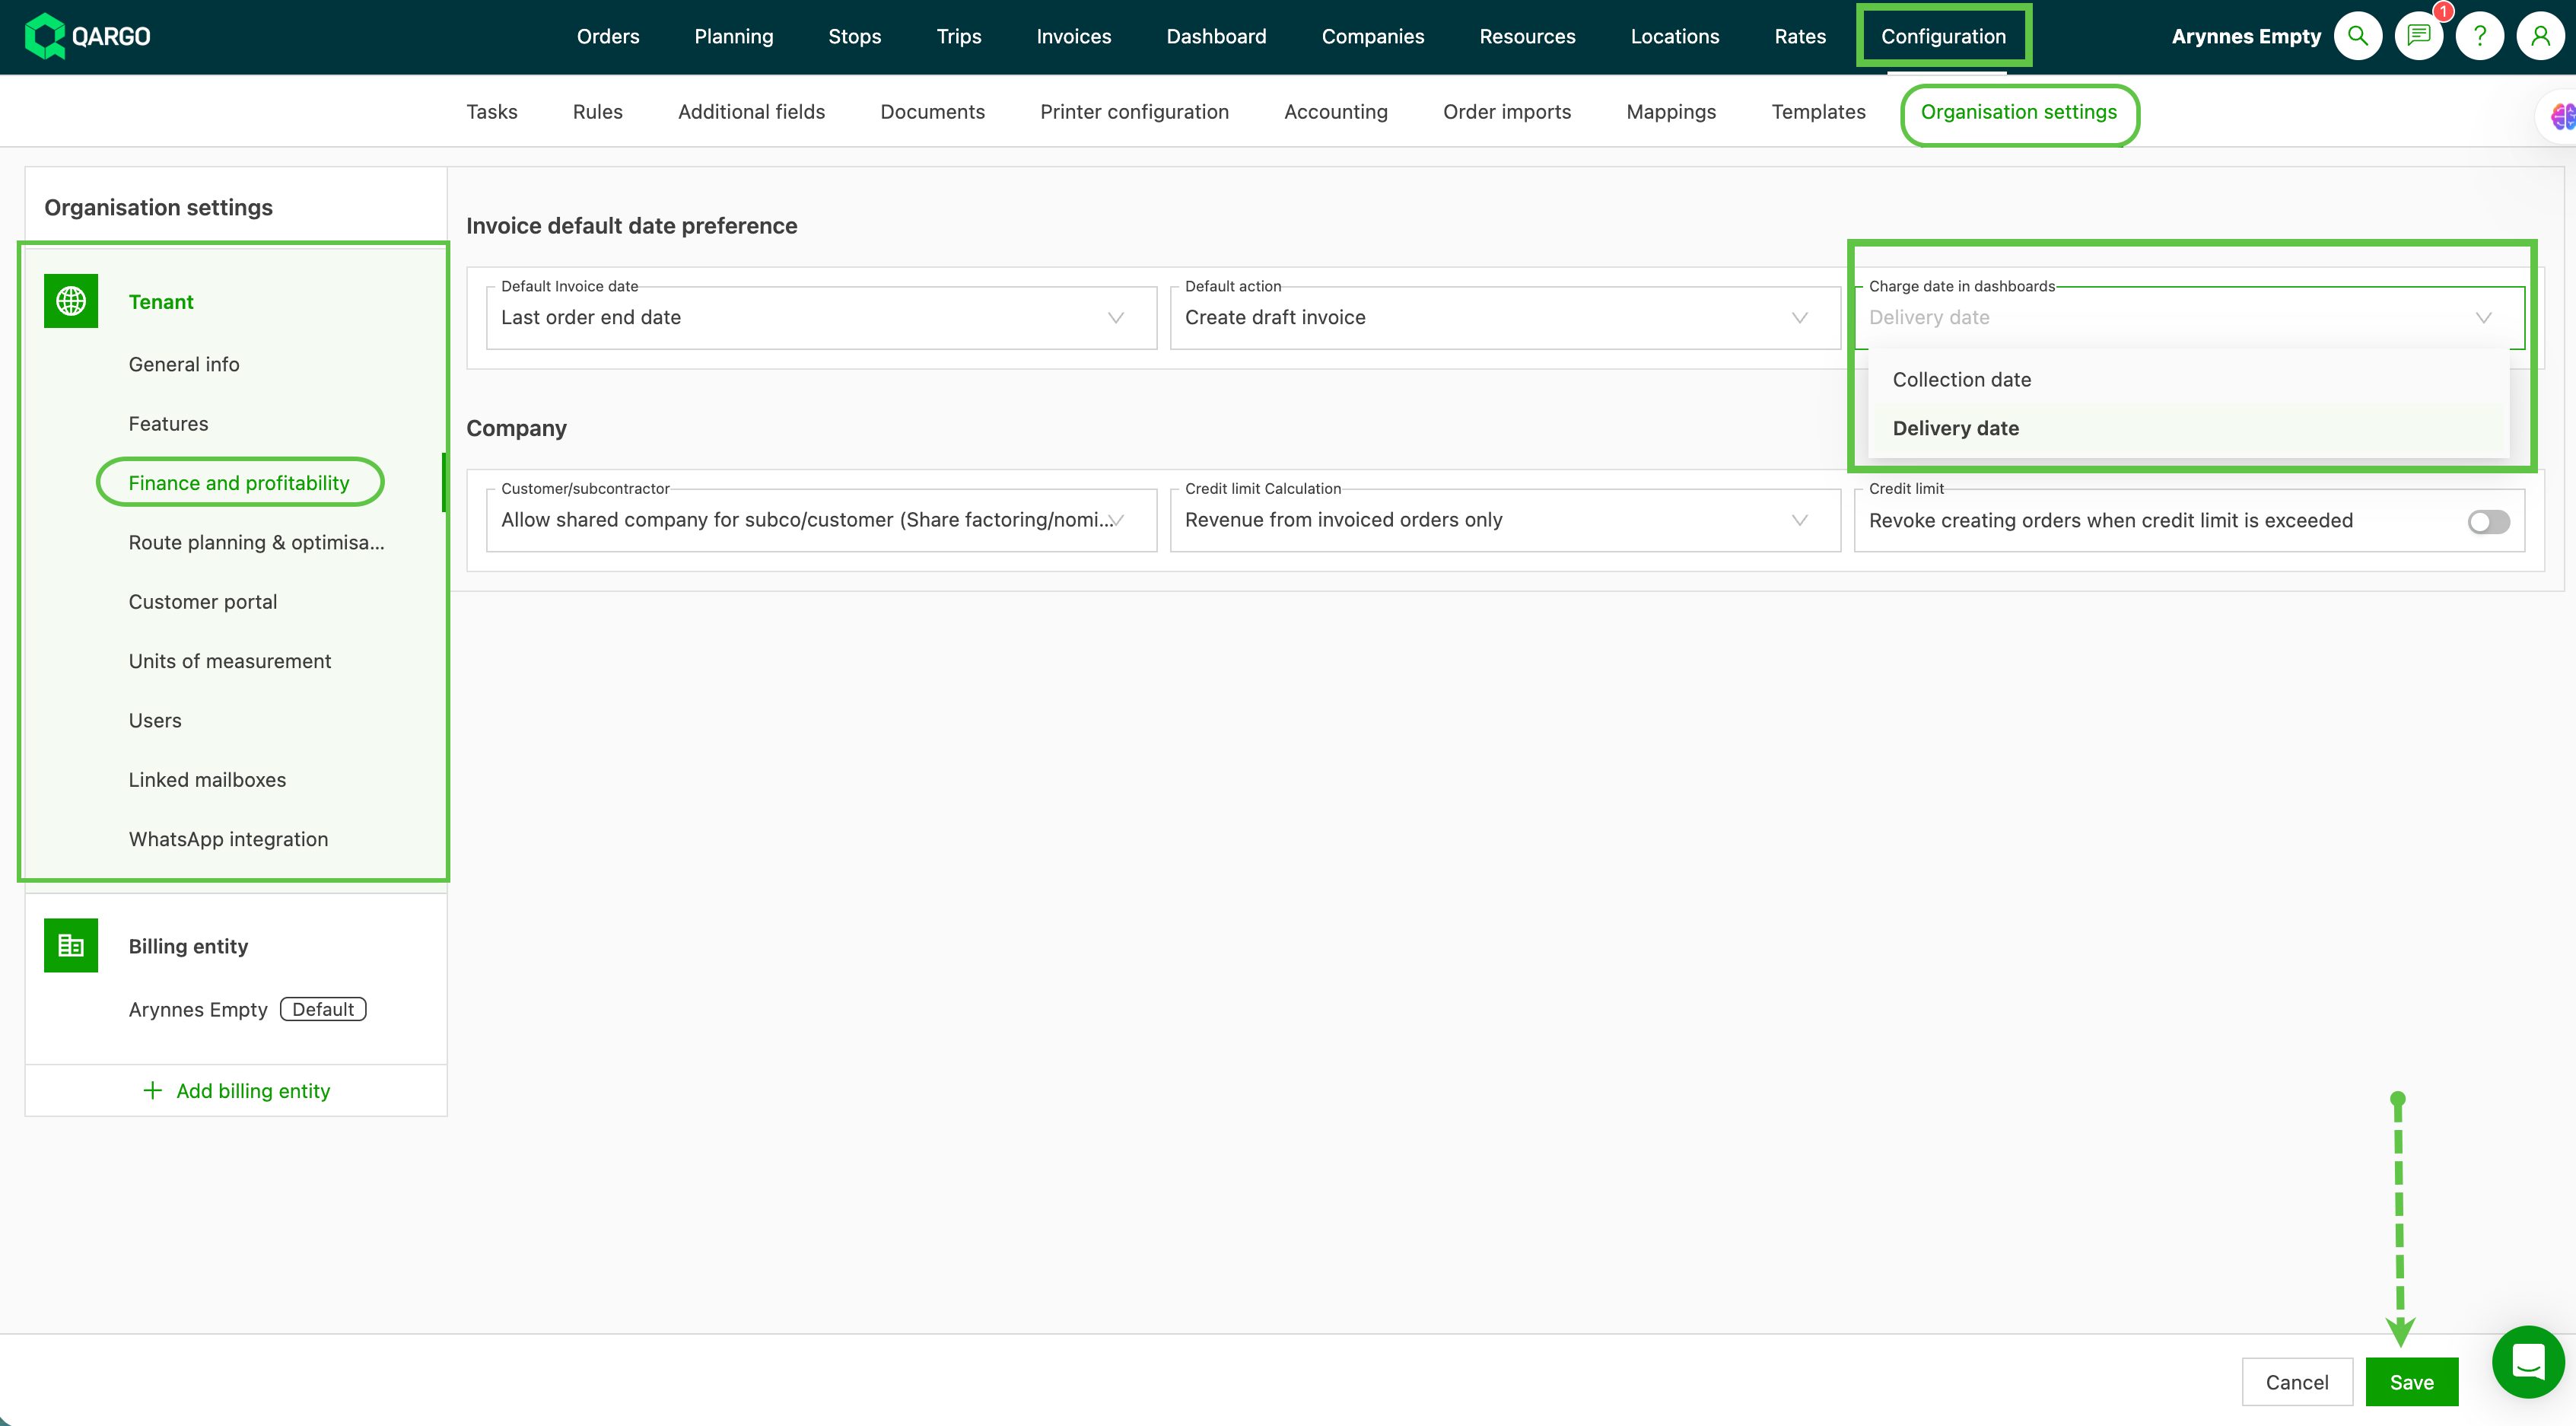
- All dashboard reports use the default date selected here.
Navigate to Dashboard
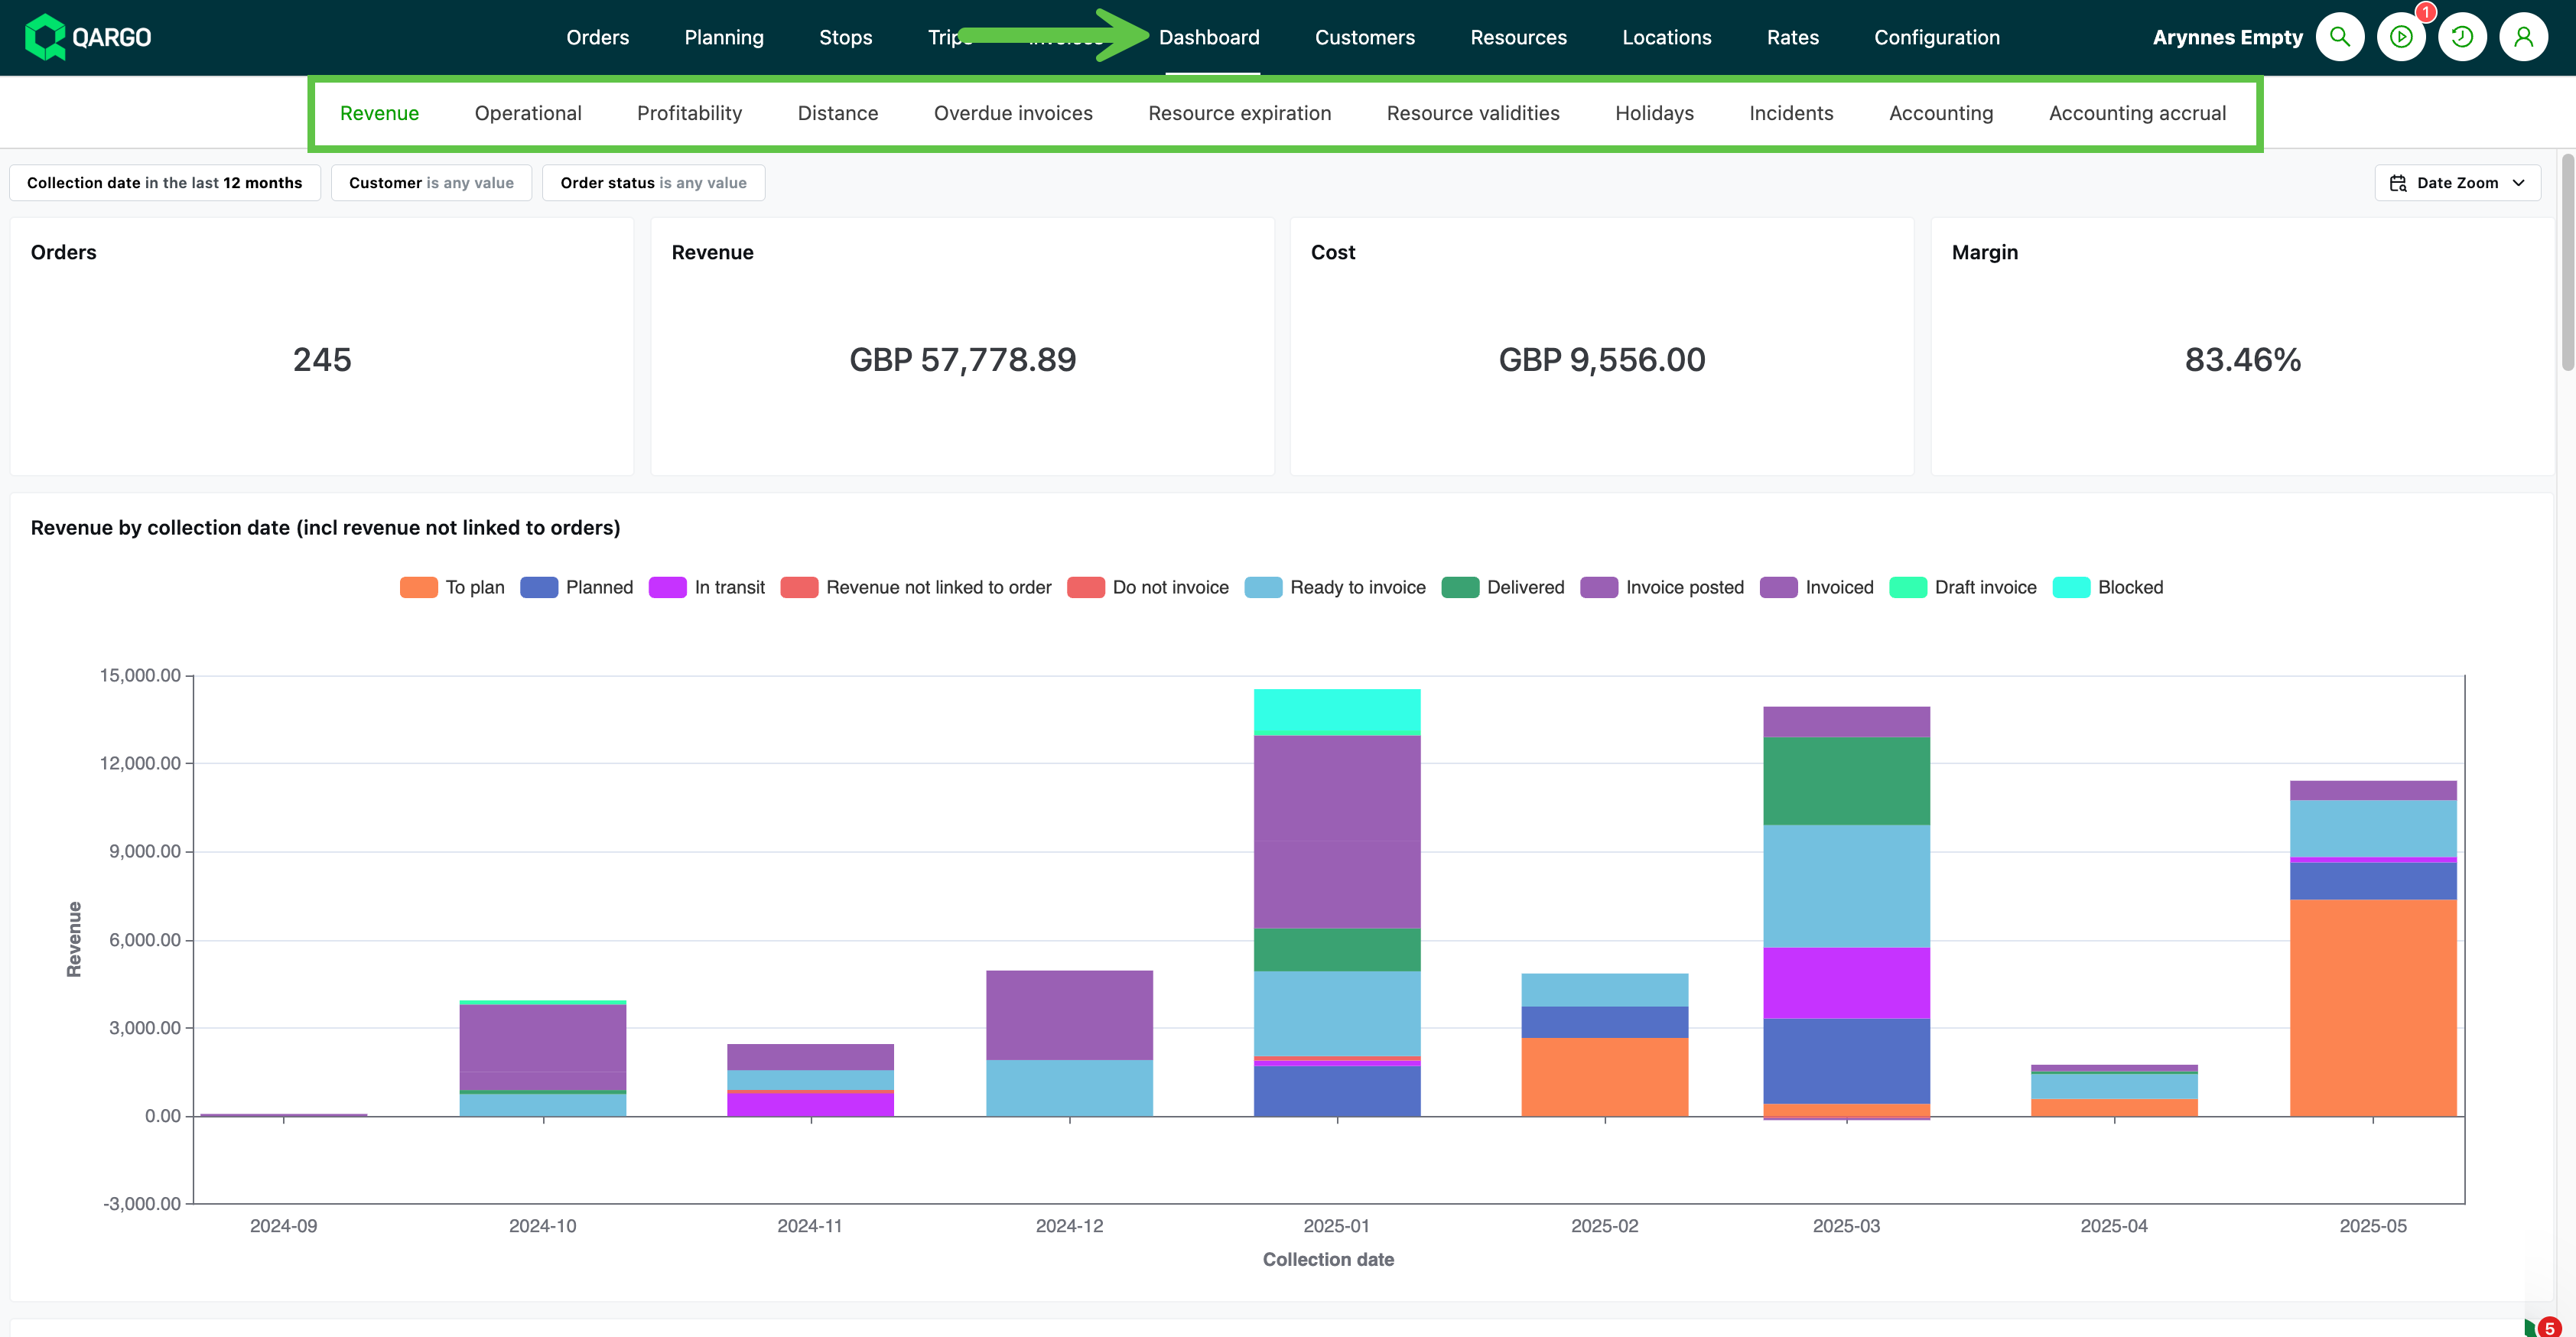
Each dashboard tab provides a comprehensive selection of graphs and tables that give insight into metrics across all aspects of the business. Click the tabs to see a visualization of a specific segment. The following segments are available:
- Revenue
- Operational
- Profitability
- Distance
- Overdue invoices
- Resource expiration
- Resource validities* (new)
- Holidays
- Incidents
- Accounting
- Accounting accrual
Filters
-
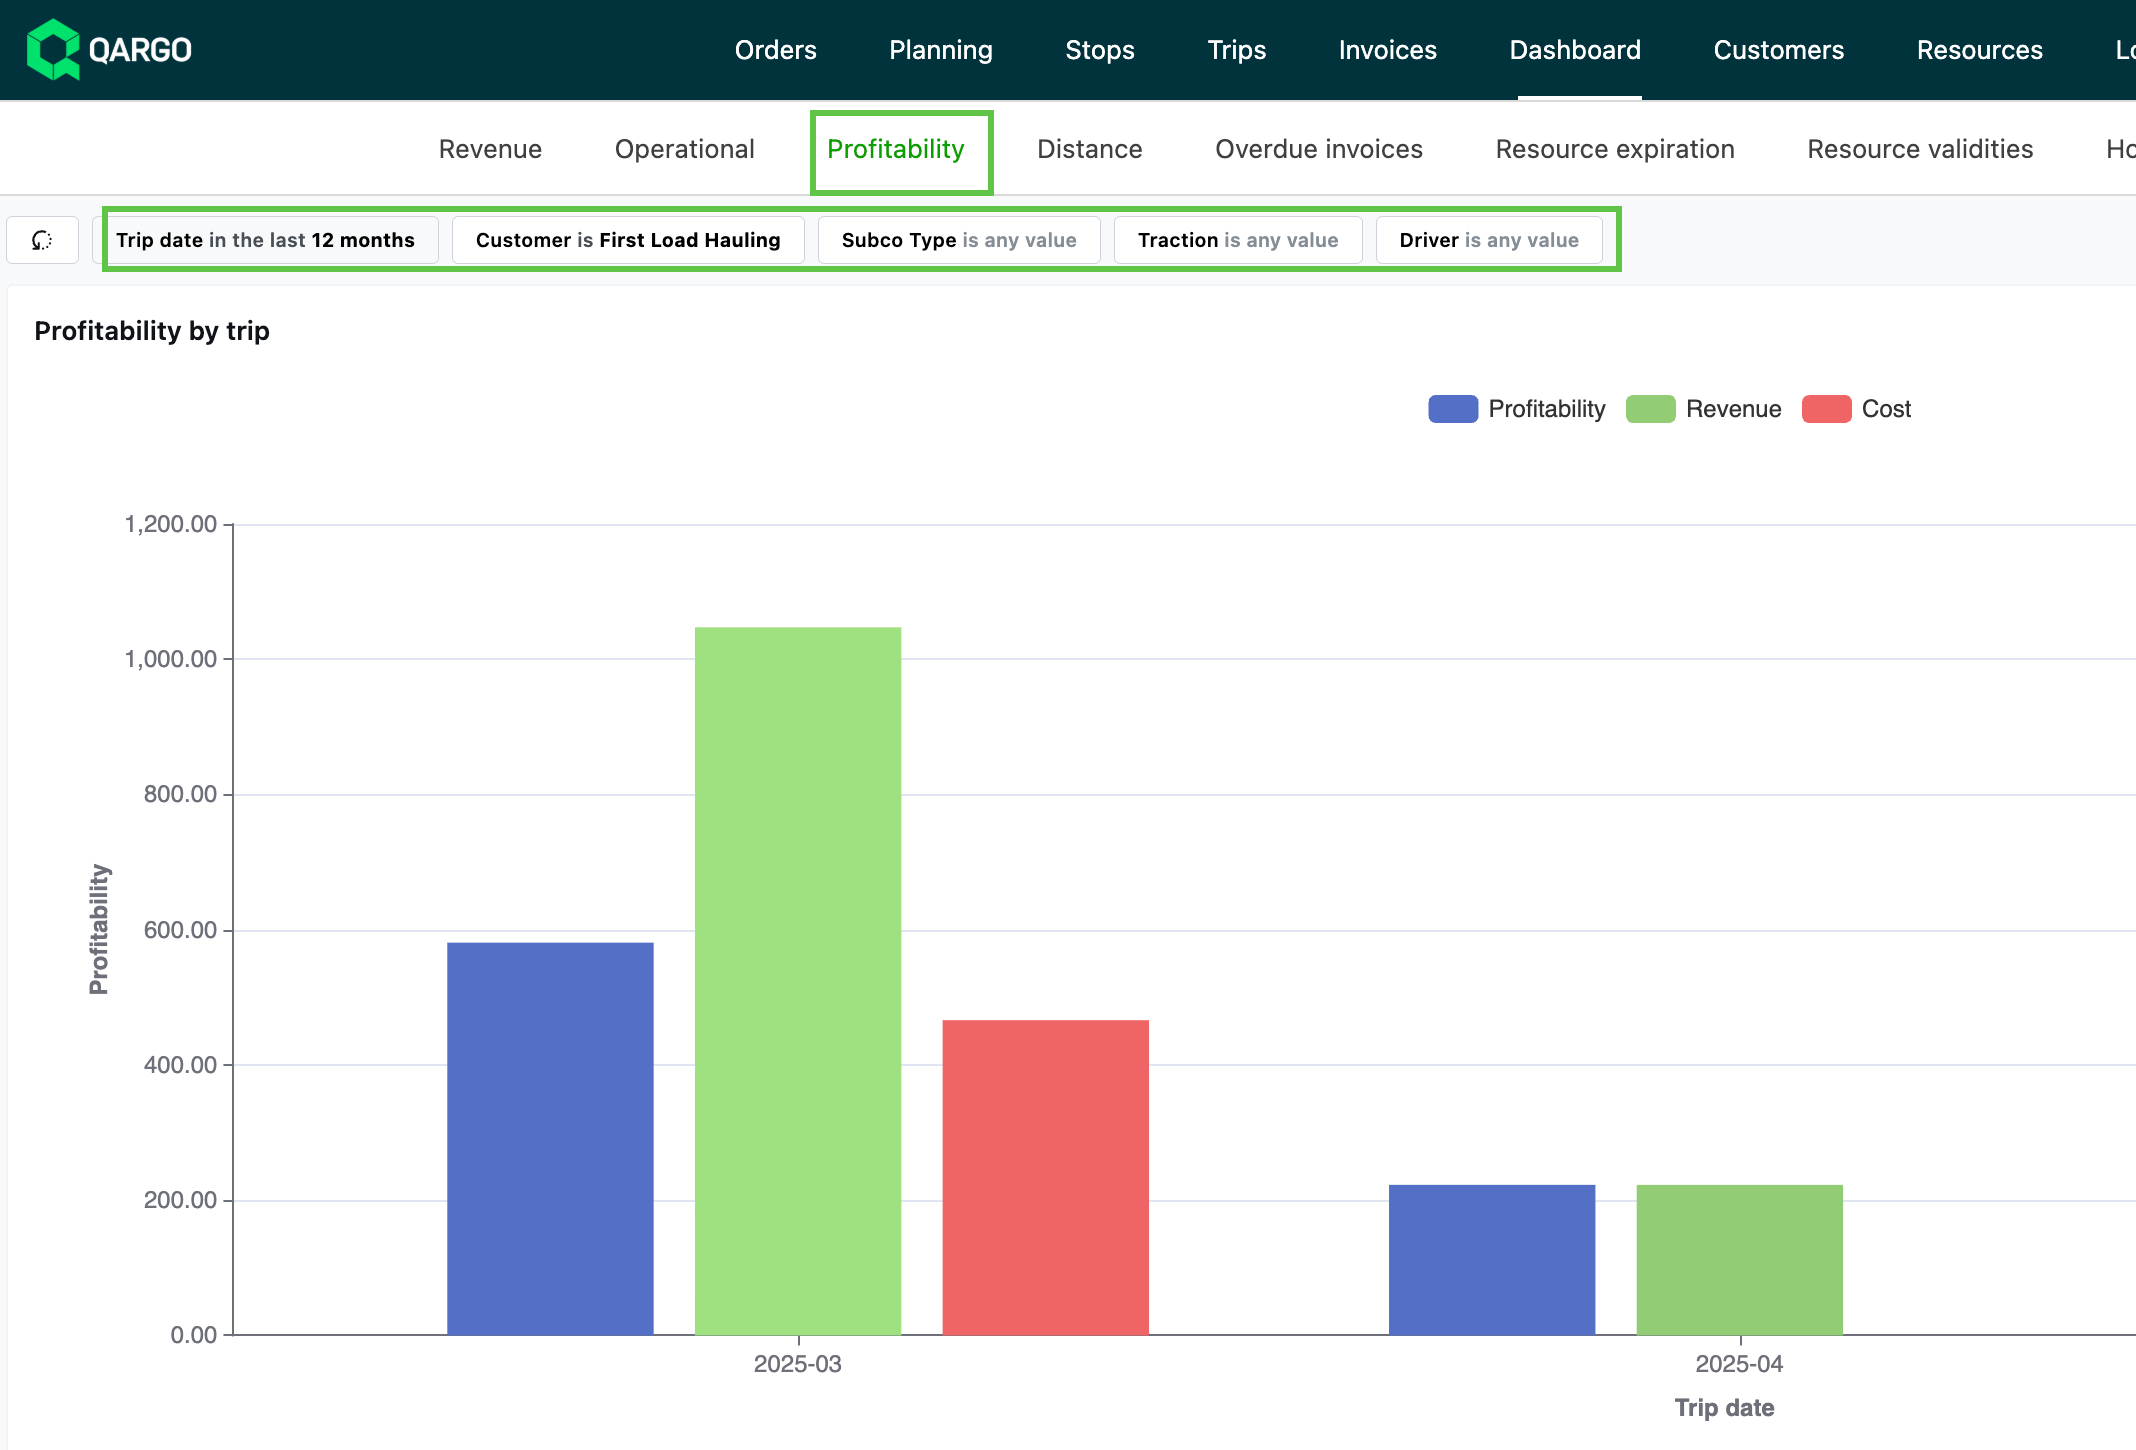
Each tab includes a variety of filters that provide further granularity, including date range, customers, or contract carriers.
-
Filters are in the same location on each tab and show what is already defined as the default.
-
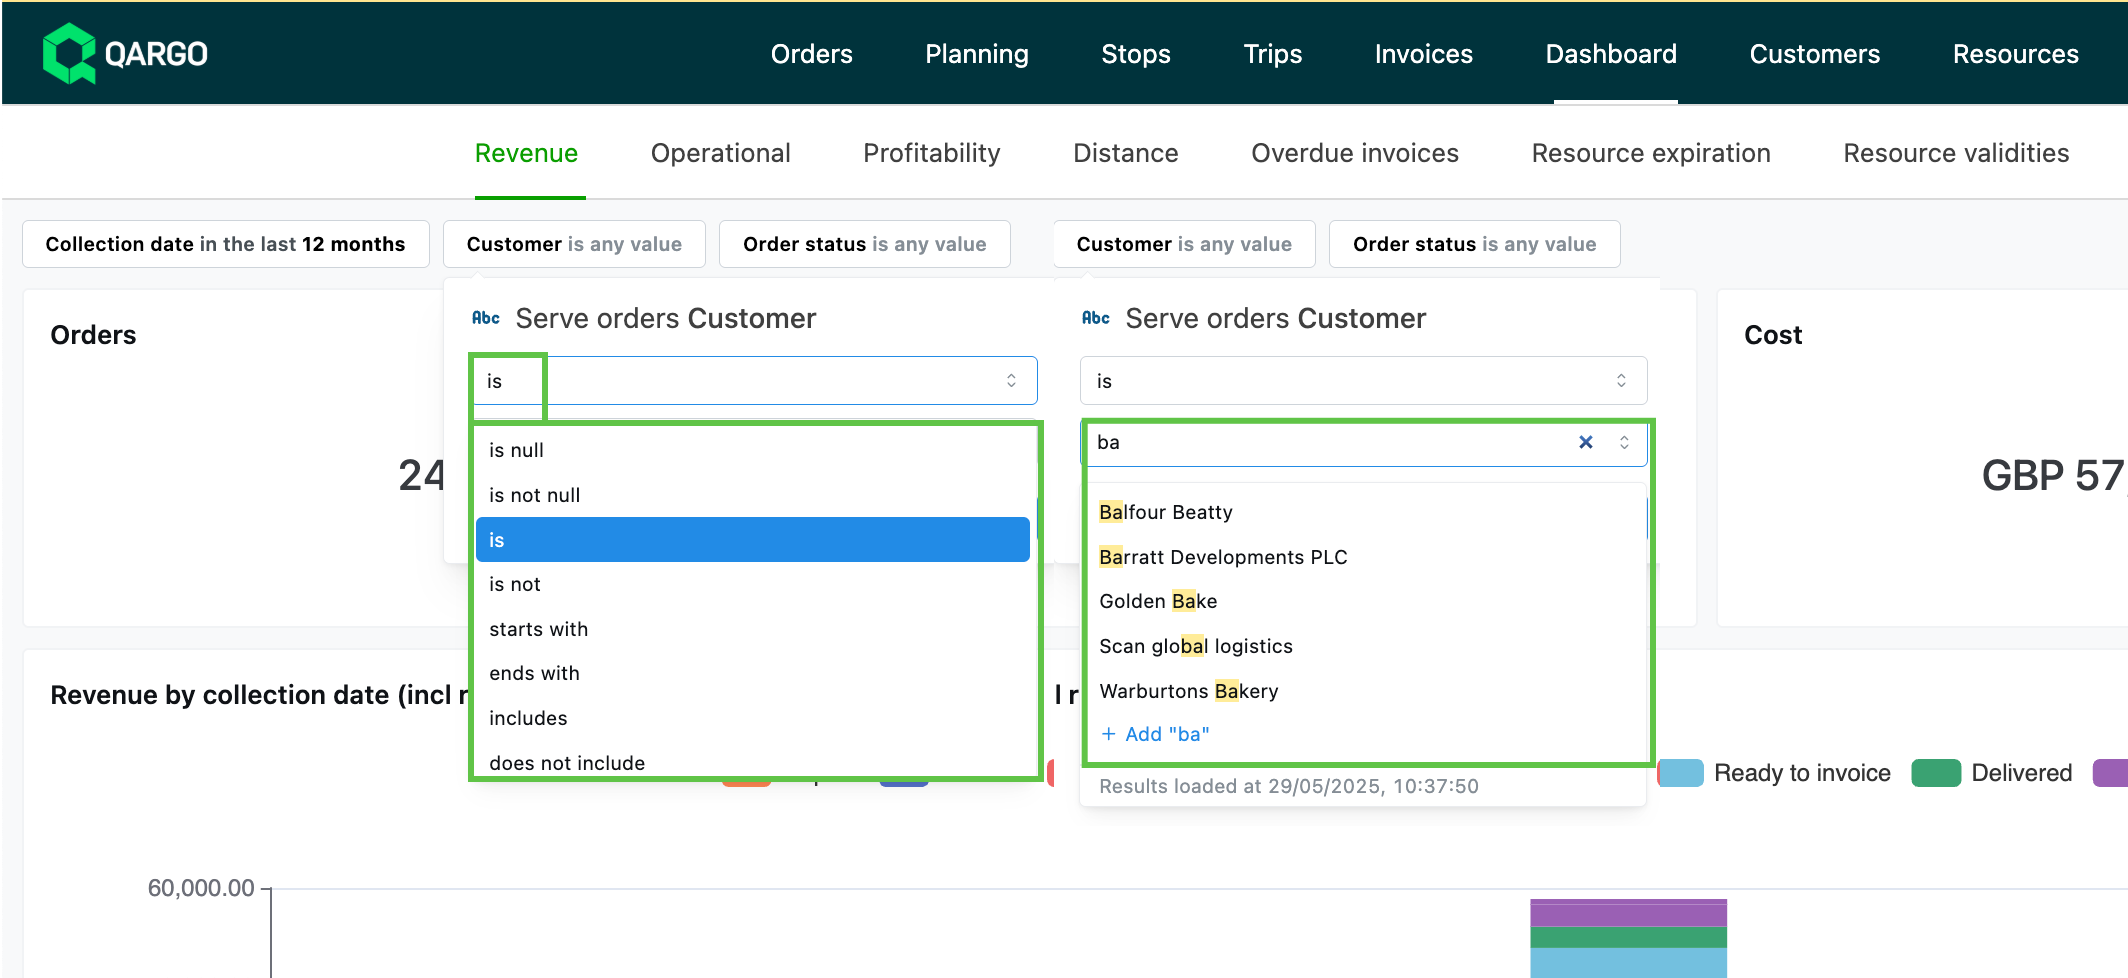
Click into a filter and adjust it to report on a specific customer, contract carrier, status, etc.
-
Each set of filters includes a Reset button to quickly and easily set filters back to the defaults.

Example:
The default Revenue parameters filter on:
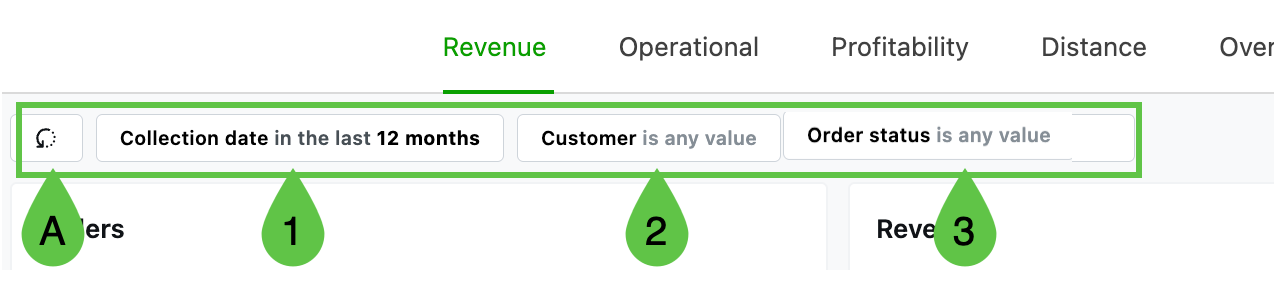
- Pickup date in the last 12 months
- Customer is any
- Order status is any
A.) Use this to reset the filters to the default
-
Click into the field to see the available filtering options.
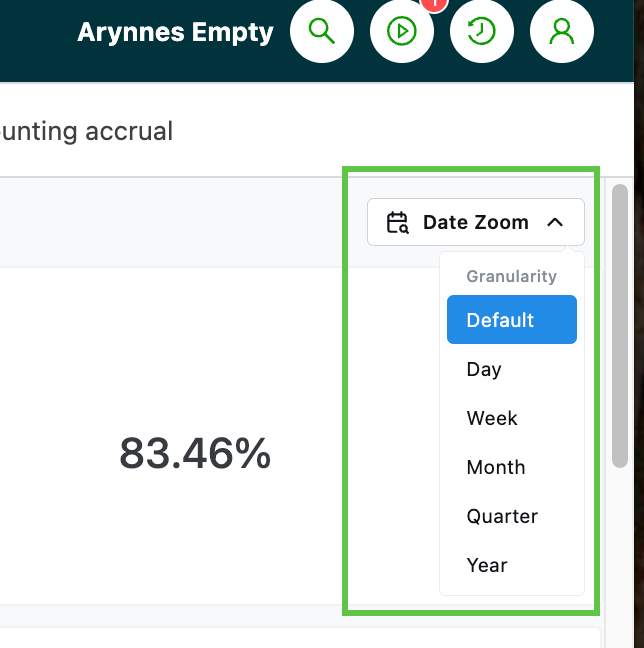
Date Zoom filter:
- Easily adjust the granularity of the date range using the Date Zoom feature.
Visualizations
- Each graph or chart includes a rollover function: hovering the mouse over a specific data point highlights all the components in the chart that match that data.
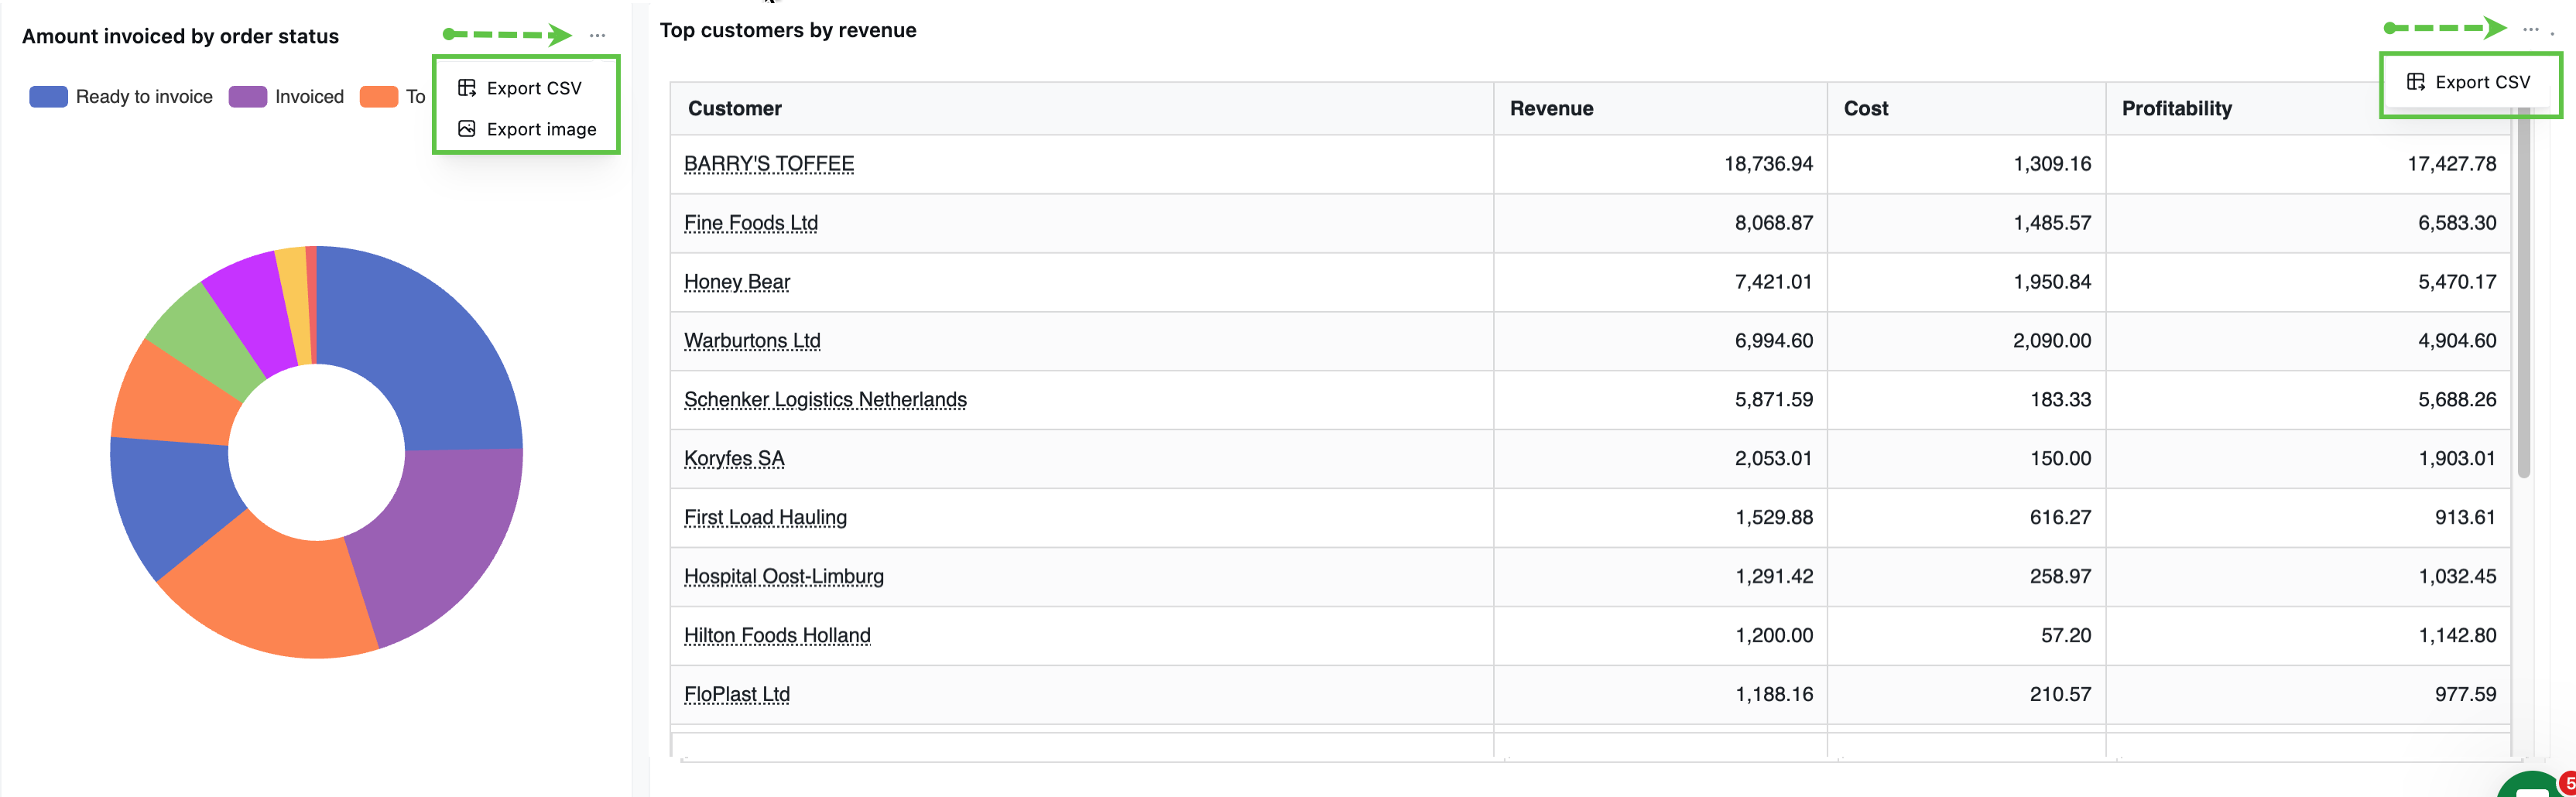
- Each graph or table can be exported (CSV or image).
- Click the 3-dot menu in the top right corner to show the export options.
Clickable links
-
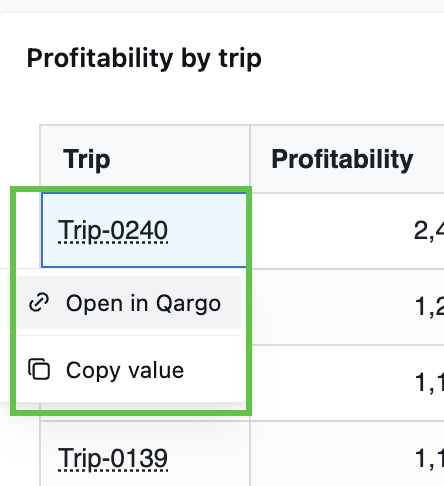
Clicking into specific data points, such as a customer name, invoice, or load number, gives the option to
-
Copy value
-
Open in Qargo
-
For a specific load, invoice, or order, this opens the specific record.
-
For a customer name, opening it in Qargo automatically opens the list view for the relevant module (orders, invoices, etc.) with filtering applied for that customer.
-
Customer vs. contract carrier reporting
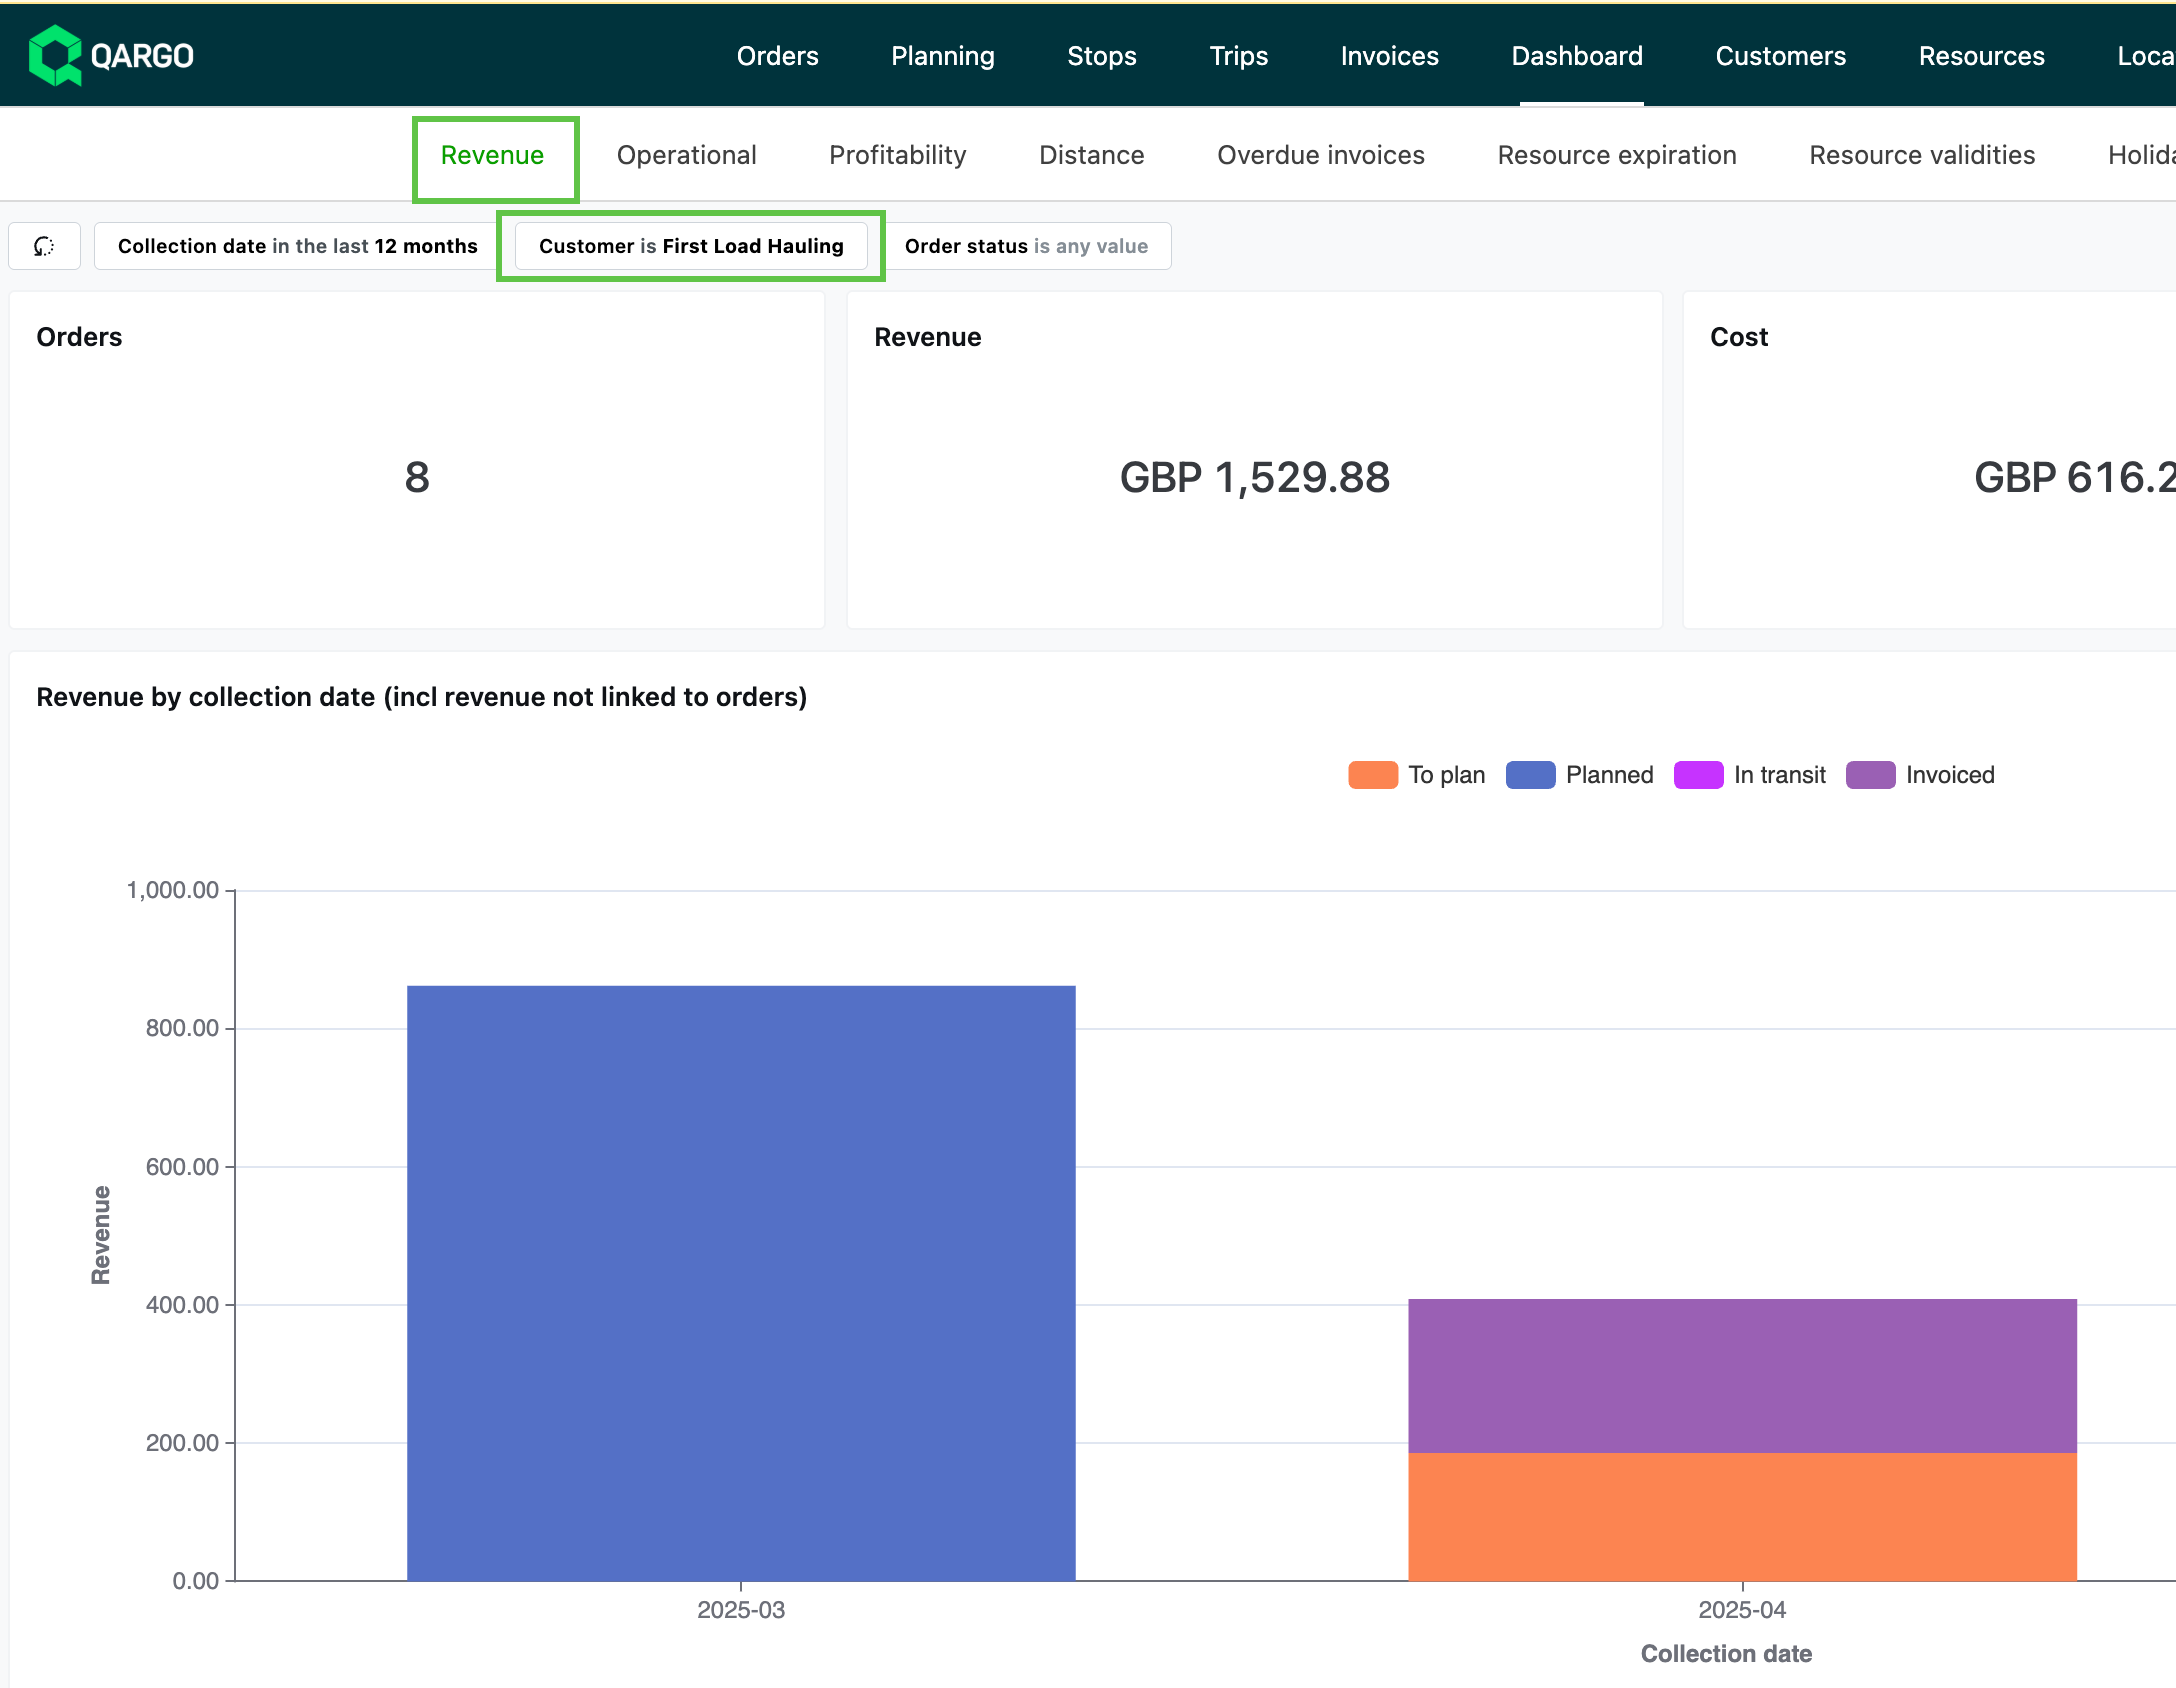
Customer and contract carrier reporting are broken out and visualized on 2 different tabs. On the appropriate tab, it is possible to filter on a specific customer or contract carrier via the ‘Customer’ search field.
-
Customer reporting = Revenue.
- In this instance, the contract carrier also appears as a customer. The Revenue table looks specifically at the orders where they were the customer.
-
Contract carrier reporting = Profitability
- In this visualization, the contract carrier is also the customer; in this instance, the data is based on loads
Resource expiration and resource validity
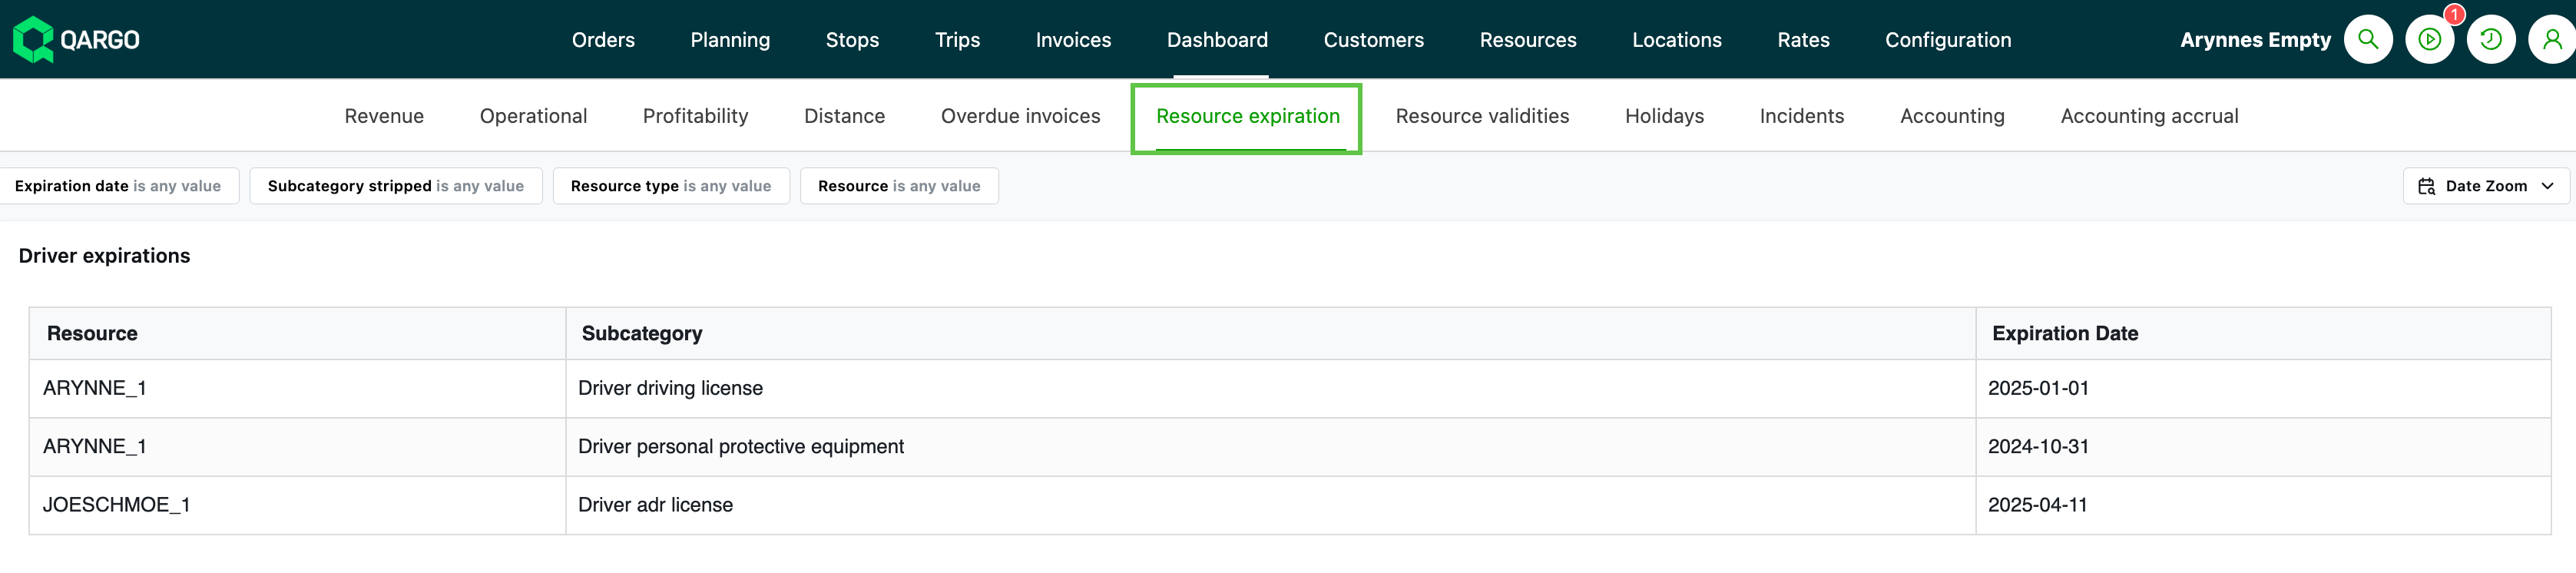
Resource expiration
- Looks at specific documents and certificates assigned to resources (especially vehicles and drivers) and reports on their expiration date, e.g., the end of licenses or permits.
- Filter on ‘expiration date’ to see when critical documents are due to expire.
- Tables are available for specific resources, e.g., driver-related expirations.
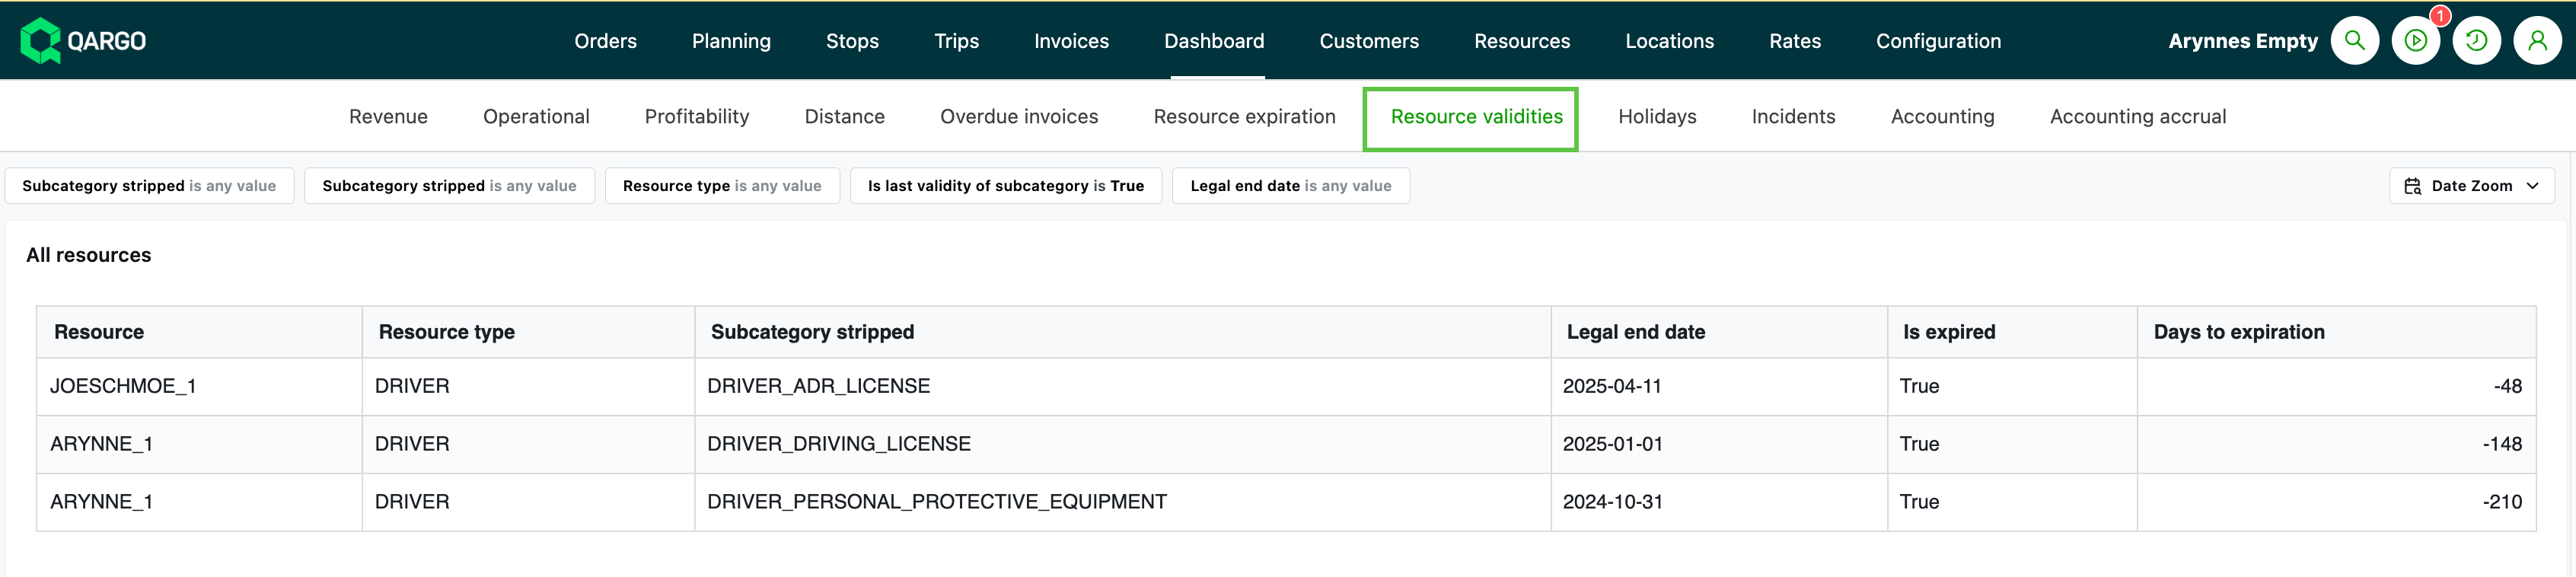
Resource validities
-
Reports on the validity period for all resources, including start and end date, expiration, and number of days until expiration.
-
Includes resources that are currently unavailable due to expired validities.
-
Filter on ‘End timestamp’ or ‘legal end date’ to view resources with dynamic unavailability
- The system automatically marks a resource as unavailable when a document expires.
\
Why 2 options? {#h_35b52fe216}
The split between the Expiration and Validity dashboards is mainly due to:
-
Customer workflow: flexibility to see all validities vs. just upcoming expirations.
-
Filtering: Resource expiration typically uses an “is between” expiration date filter, while Resource validity dashboards use filters on the legal end date.
Summary:
- Use Resource expiration for a quick, focused list of items that are about to expire soon (with direct date-based filtering).
- Use Resource validity to see the full range of validity periods for resources (including those that have already expired or are causing current unavailability).