
Planning: map features and functions
Mapping tool offers layered view, easy stop identification, interactive traffic data, and better selection tools in a streamlined interface.
Table of contents
The mapping tool in Qargo offers a variety of features and benefits to users. Improved customization allows different layered views and easily identified stop icons. Performance on the page is also improved, even with more data being shown.
Customizing views.
-
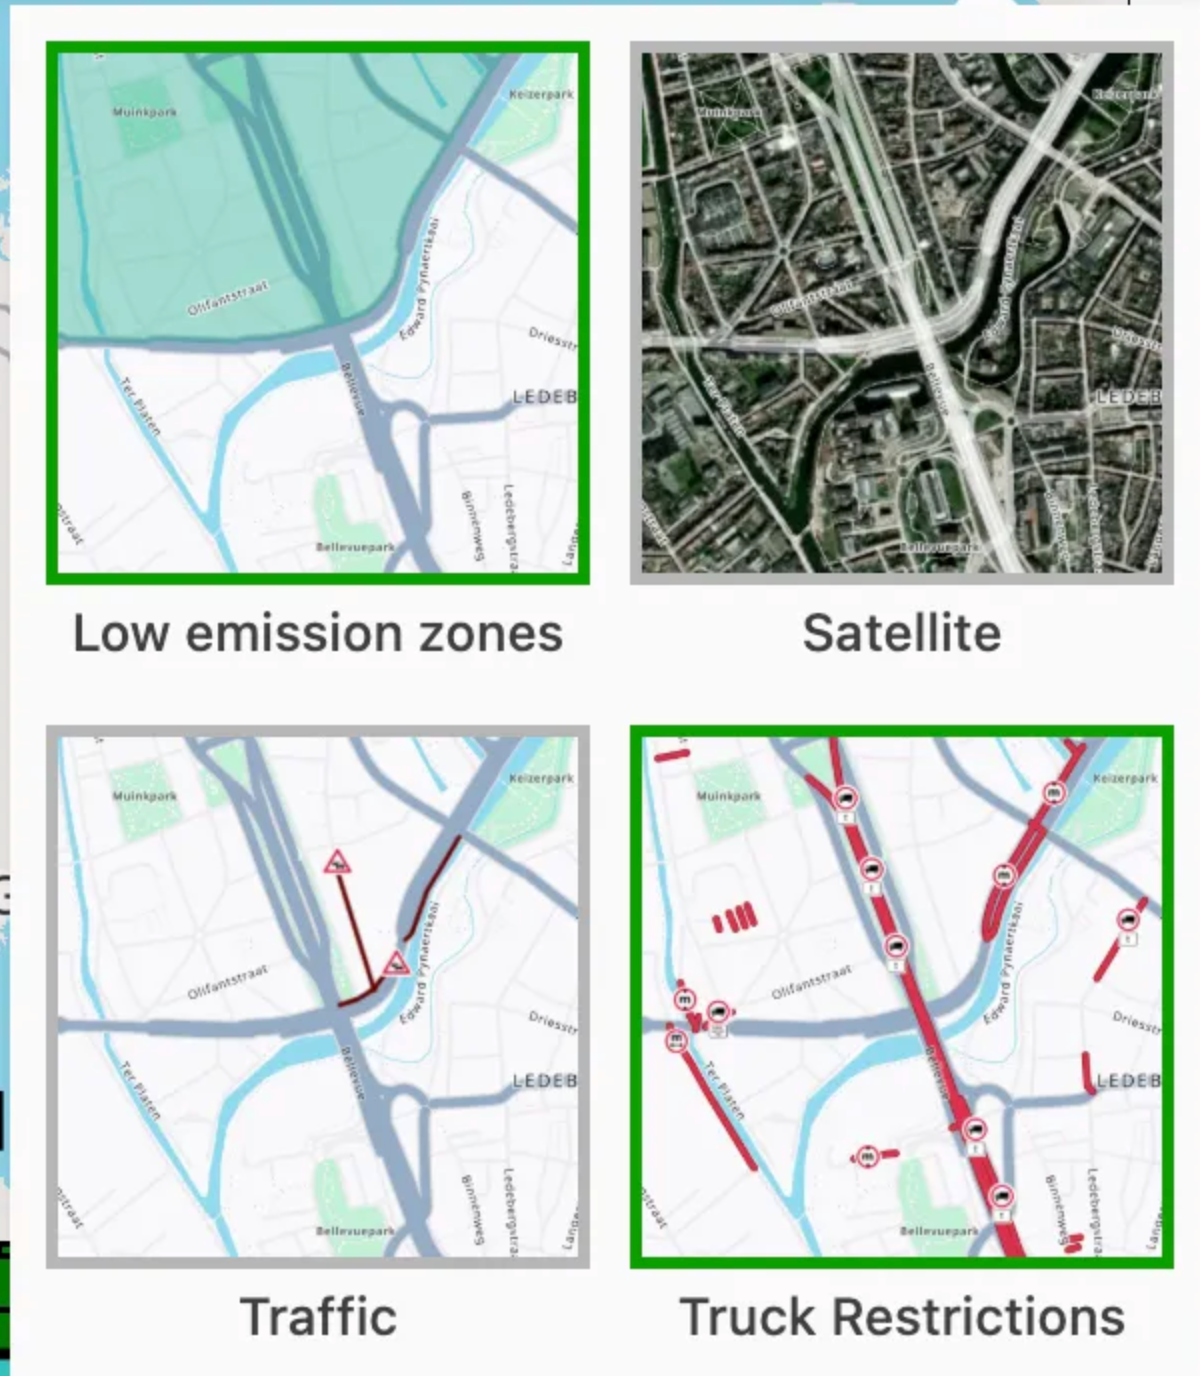
Apply different layered views, based on user preferences. Layers include:
- Satellite
- Low emission zone (LEZ)
- Live traffic
- Truck restrictions
-
Improved visibility of a stop type allows users to focus on specific activity requirements. ‘To plan stops’ can now be hidden per stop type (pickups, deliveries, etc.).
-
Resources can be hidden
Stop visibility
-
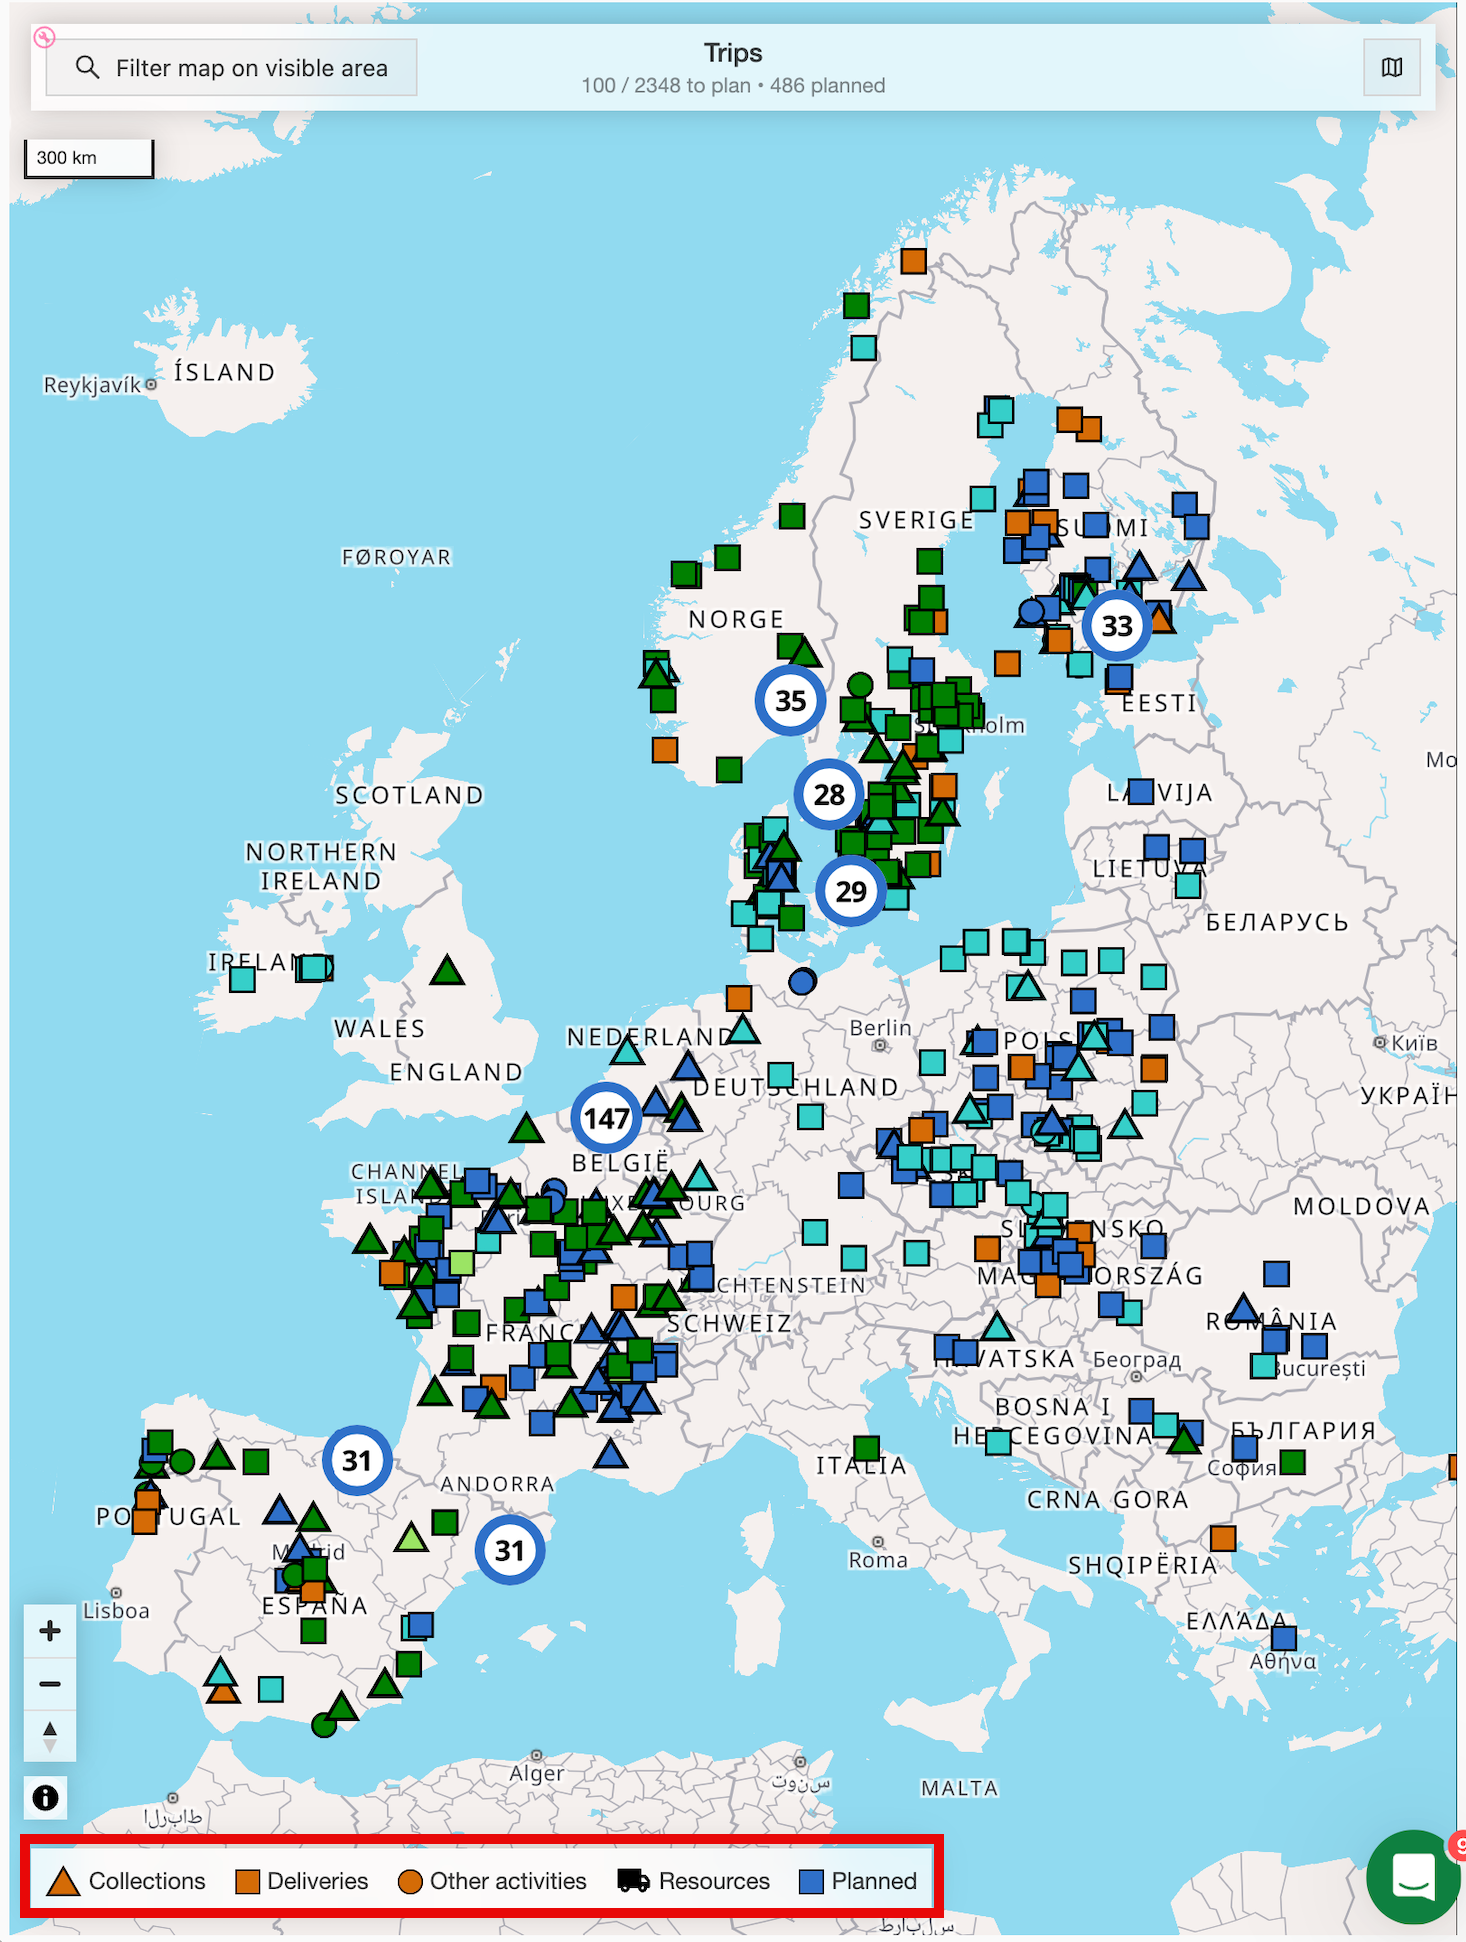
Stops are now represented by shapes instead of icons.
-
A legend on the map shows at a glance what kind of stop a marker represents.
- Triangle = Pickup
- Square = Delivery
- Circle = Other
-
-
Stop markers are now shown in the color of their status.
- Combining the stop marker with the status color gives clear visibility of stop status and load progress.
-
Resources are now represented by truck icons instead of circles.
Interactive functionality
-
Live traffic layer available.
- Shows real-time traffic to support decision-making when planning loads.
-
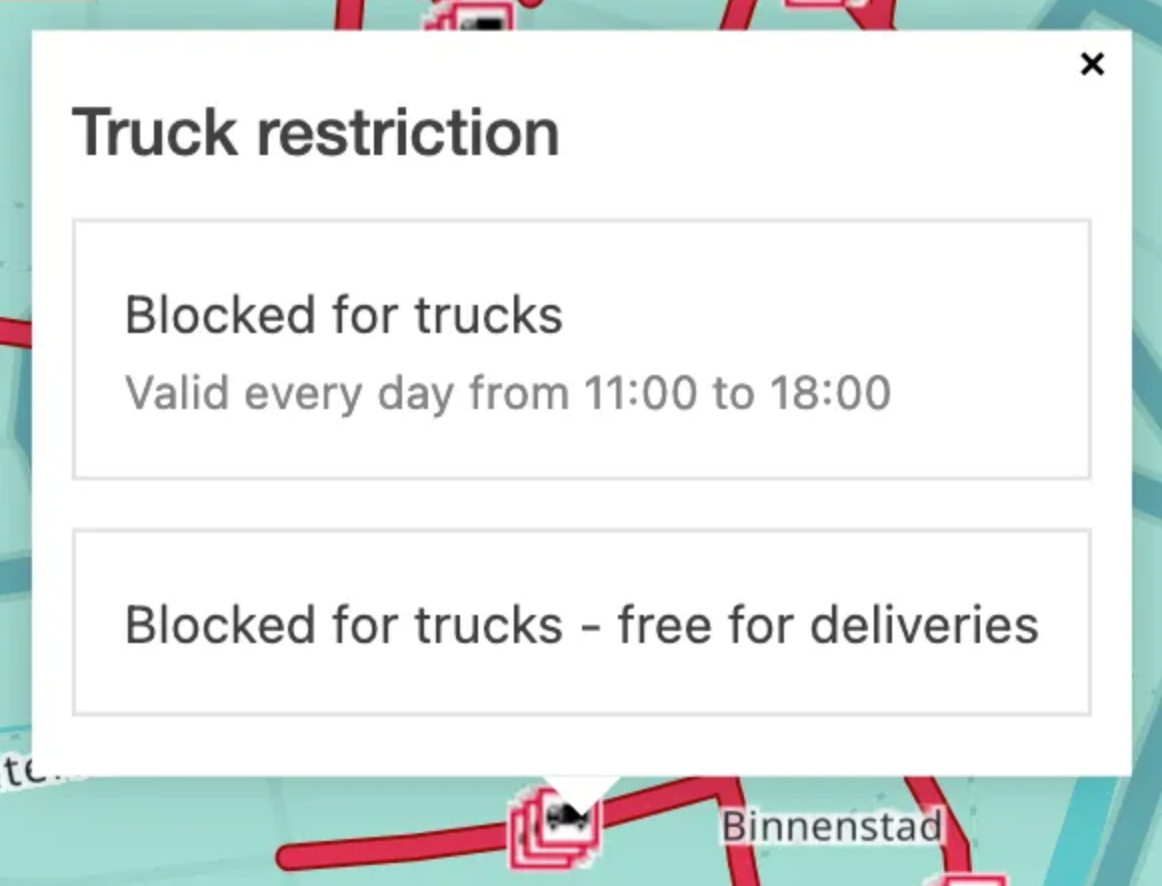
Truck restrictions are now interactive.
- Clicking the icon displays more information about the restriction and the times when it applies.
Planning features
Select to plan orders
Multiple orders in a certain area can be selected quickly for planning. This is similar to selecting rows in the ‘To plan’ list, or clicking ‘To plan’ stops individually on the map.
-
2 options to ‘draw’ on the map
- Click, hold and drag = Rectangle area selector
- Click once to define edges = Polygon area selector
-
Click the icon to enable the ‘Map selection’ function
-
Rectangle: Select a point on the map, then click and drag to define the area. Orders within this area are then selected for planning.
-
Polygon: Click on the map (without holding) and draw the area to select by clicking each corner of the polygon. Double-click to end the selection.
‘To plan’ orders on the map
The planning board map loads up to 1,000 orders with status To plan across all pages at the same time. Planners with large order volumes get a full geographic overview of all unplanned work without paging through results.
Previously, only the orders visible on the current page (up to 100) were shown on the map. This change removes that restriction.
Stop popover
Clicking a map location opens a popover listing all orders at that stop. The popover header shows the total number of orders at the location.
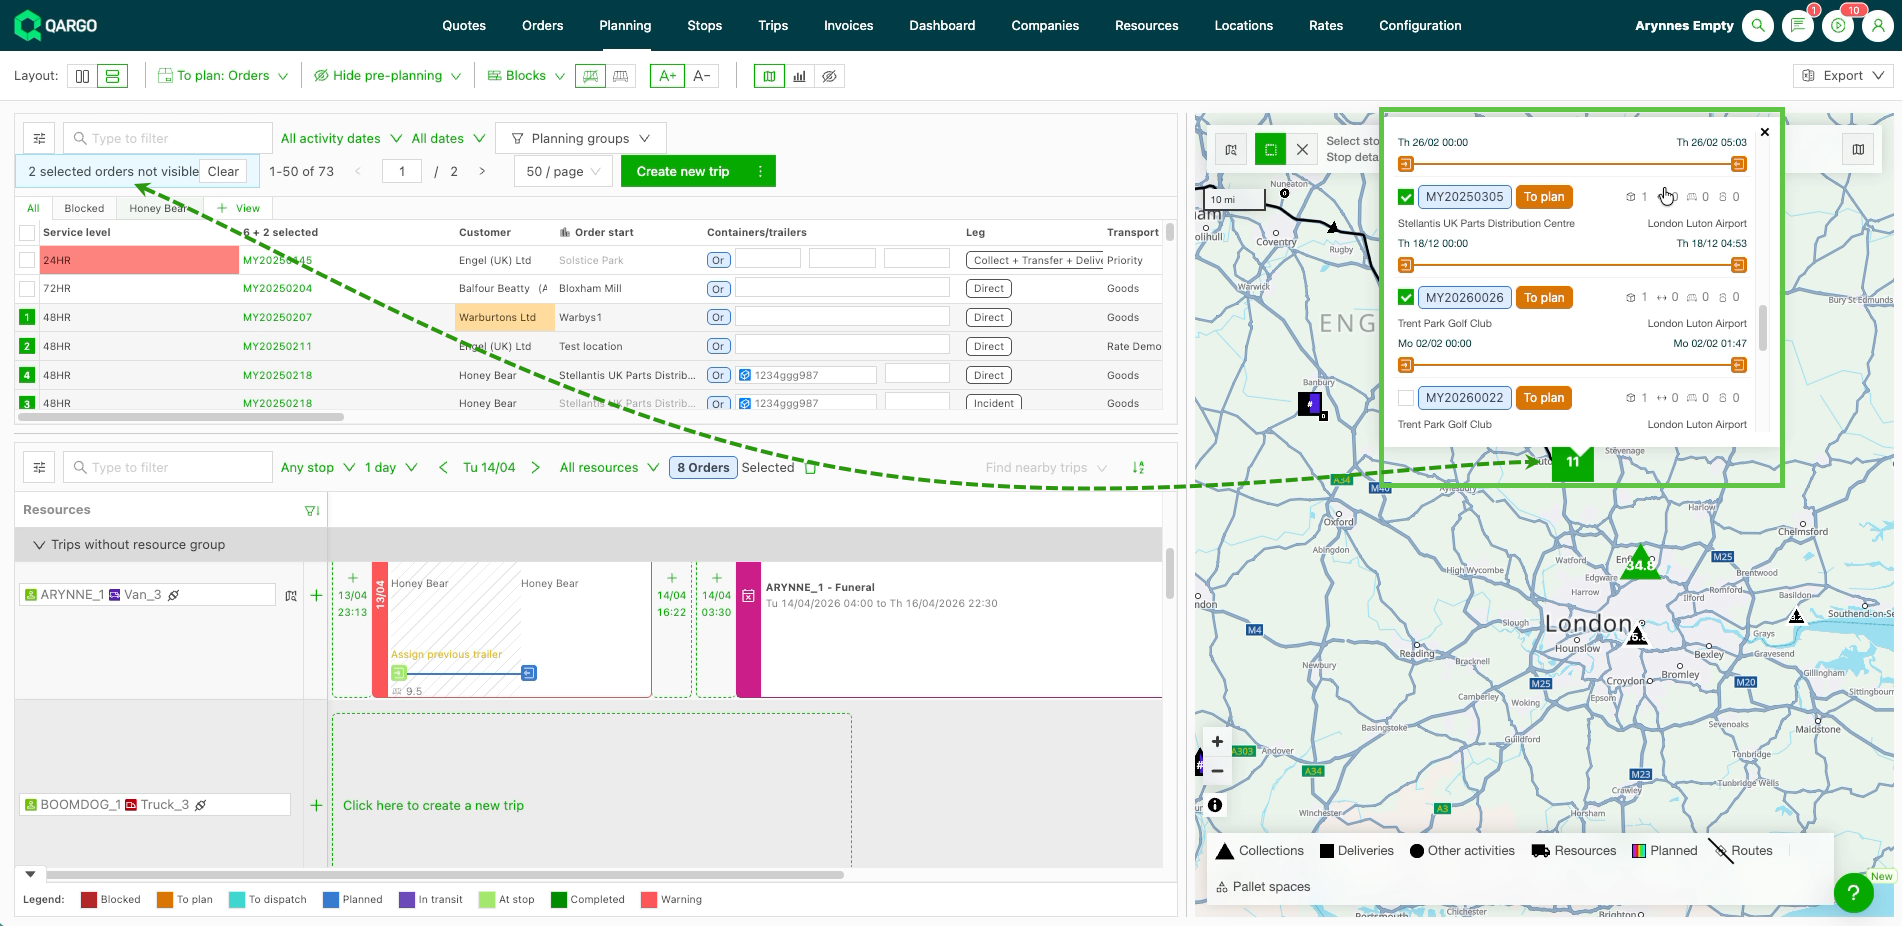
Each order listed in the popover displays:
- First and last stop with address, date, and time
- Goods metrics; intermediate stops in a compact format
- For planned orders: the assigned resource and load tag
Selecting orders from the popover
Orders can be selected directly from the popover. Selecting an order’s checkbox also selects the matching row in the To plan section of the planning board.
Additional interaction options:
- Cmd / Ctrl + click: quickly select multiple orders in sequence
- Clicking an order tag opens the Order detail view
- Clicking a load tag opens the Load detail view
- Hovering over a load tag in the popover highlights the matching load on the planning board timeline
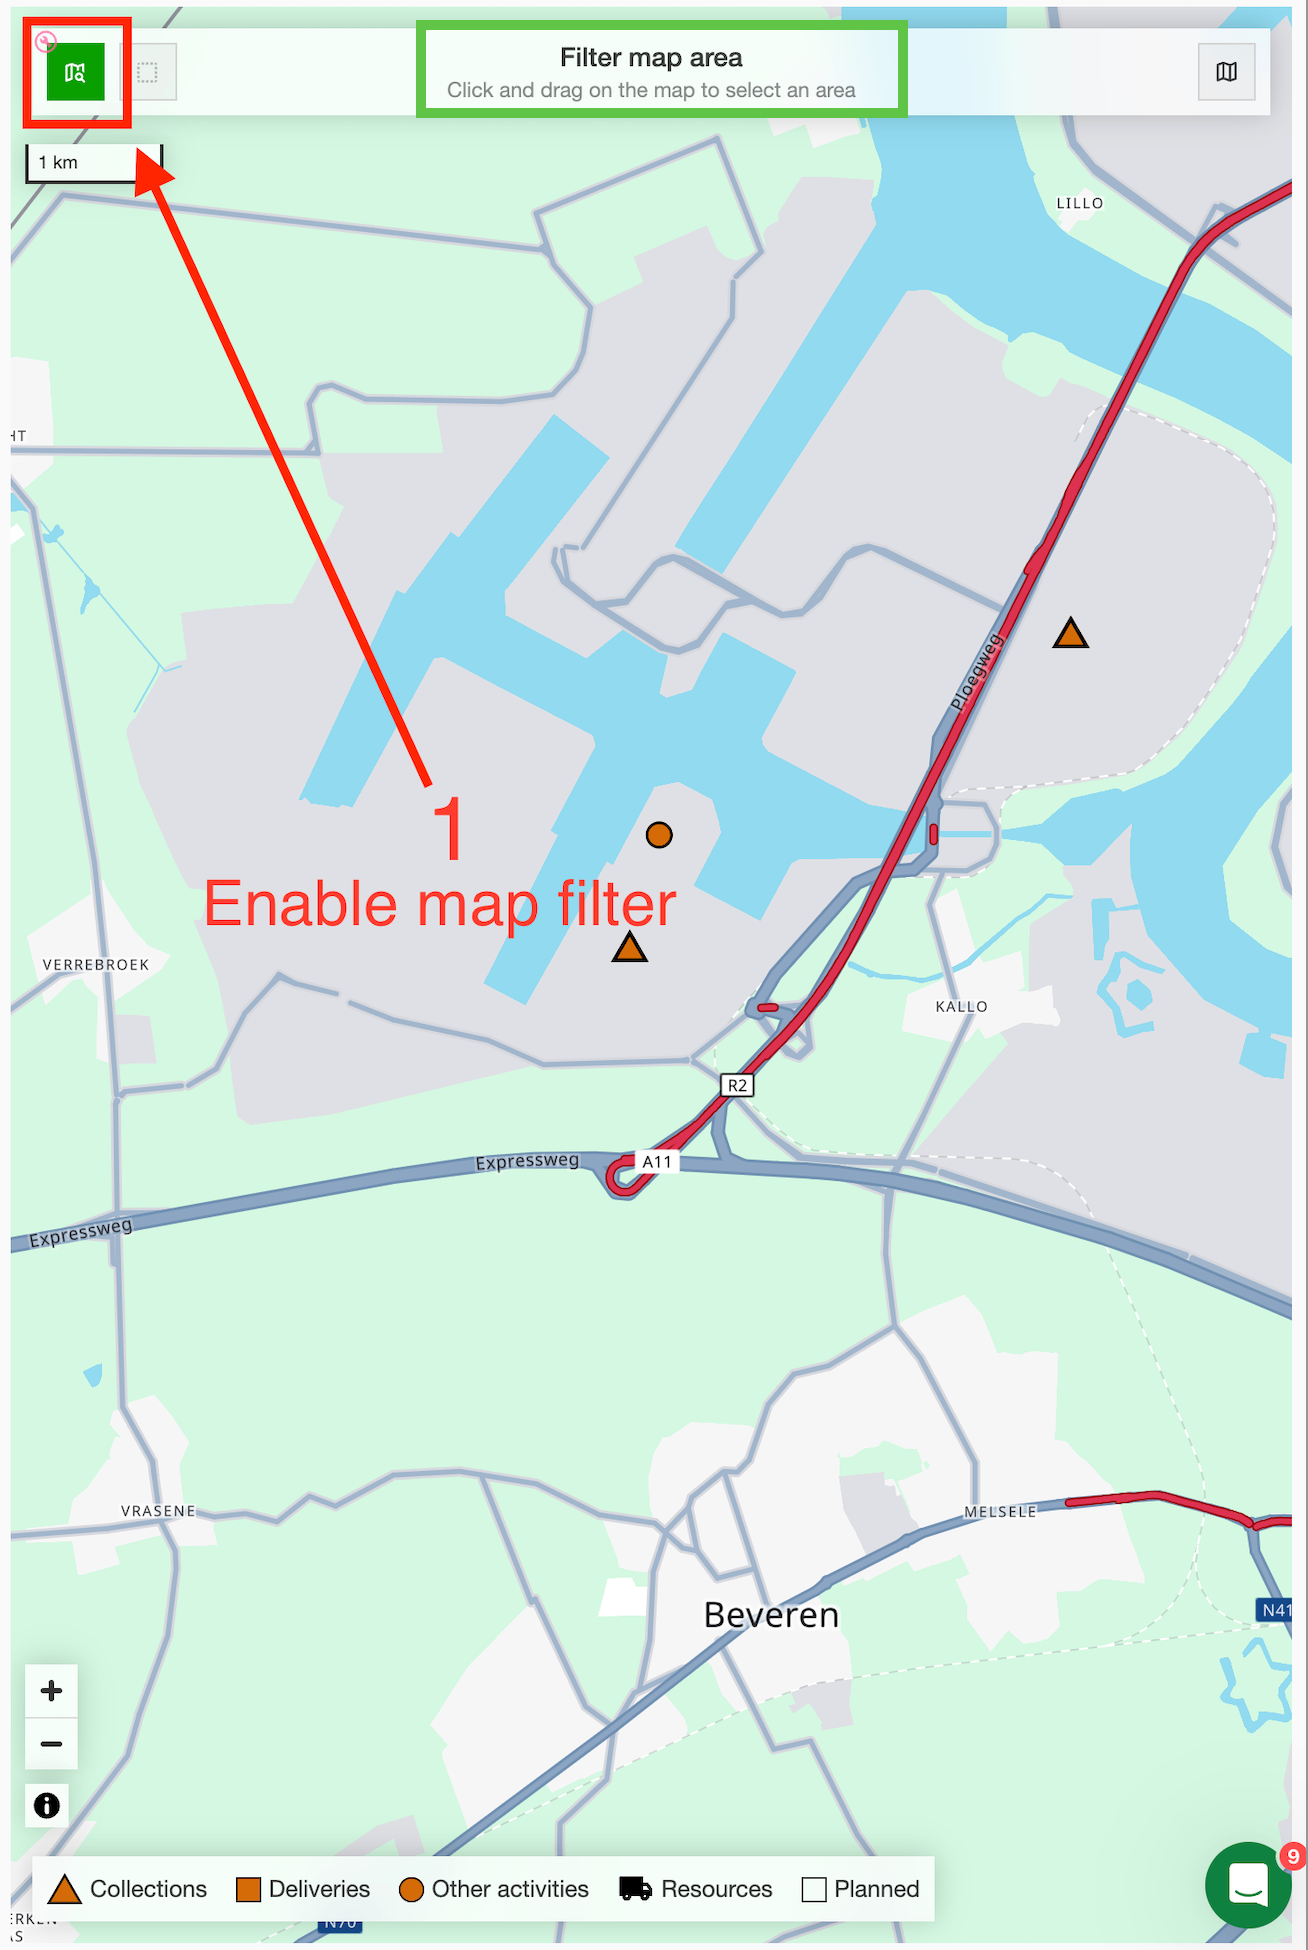
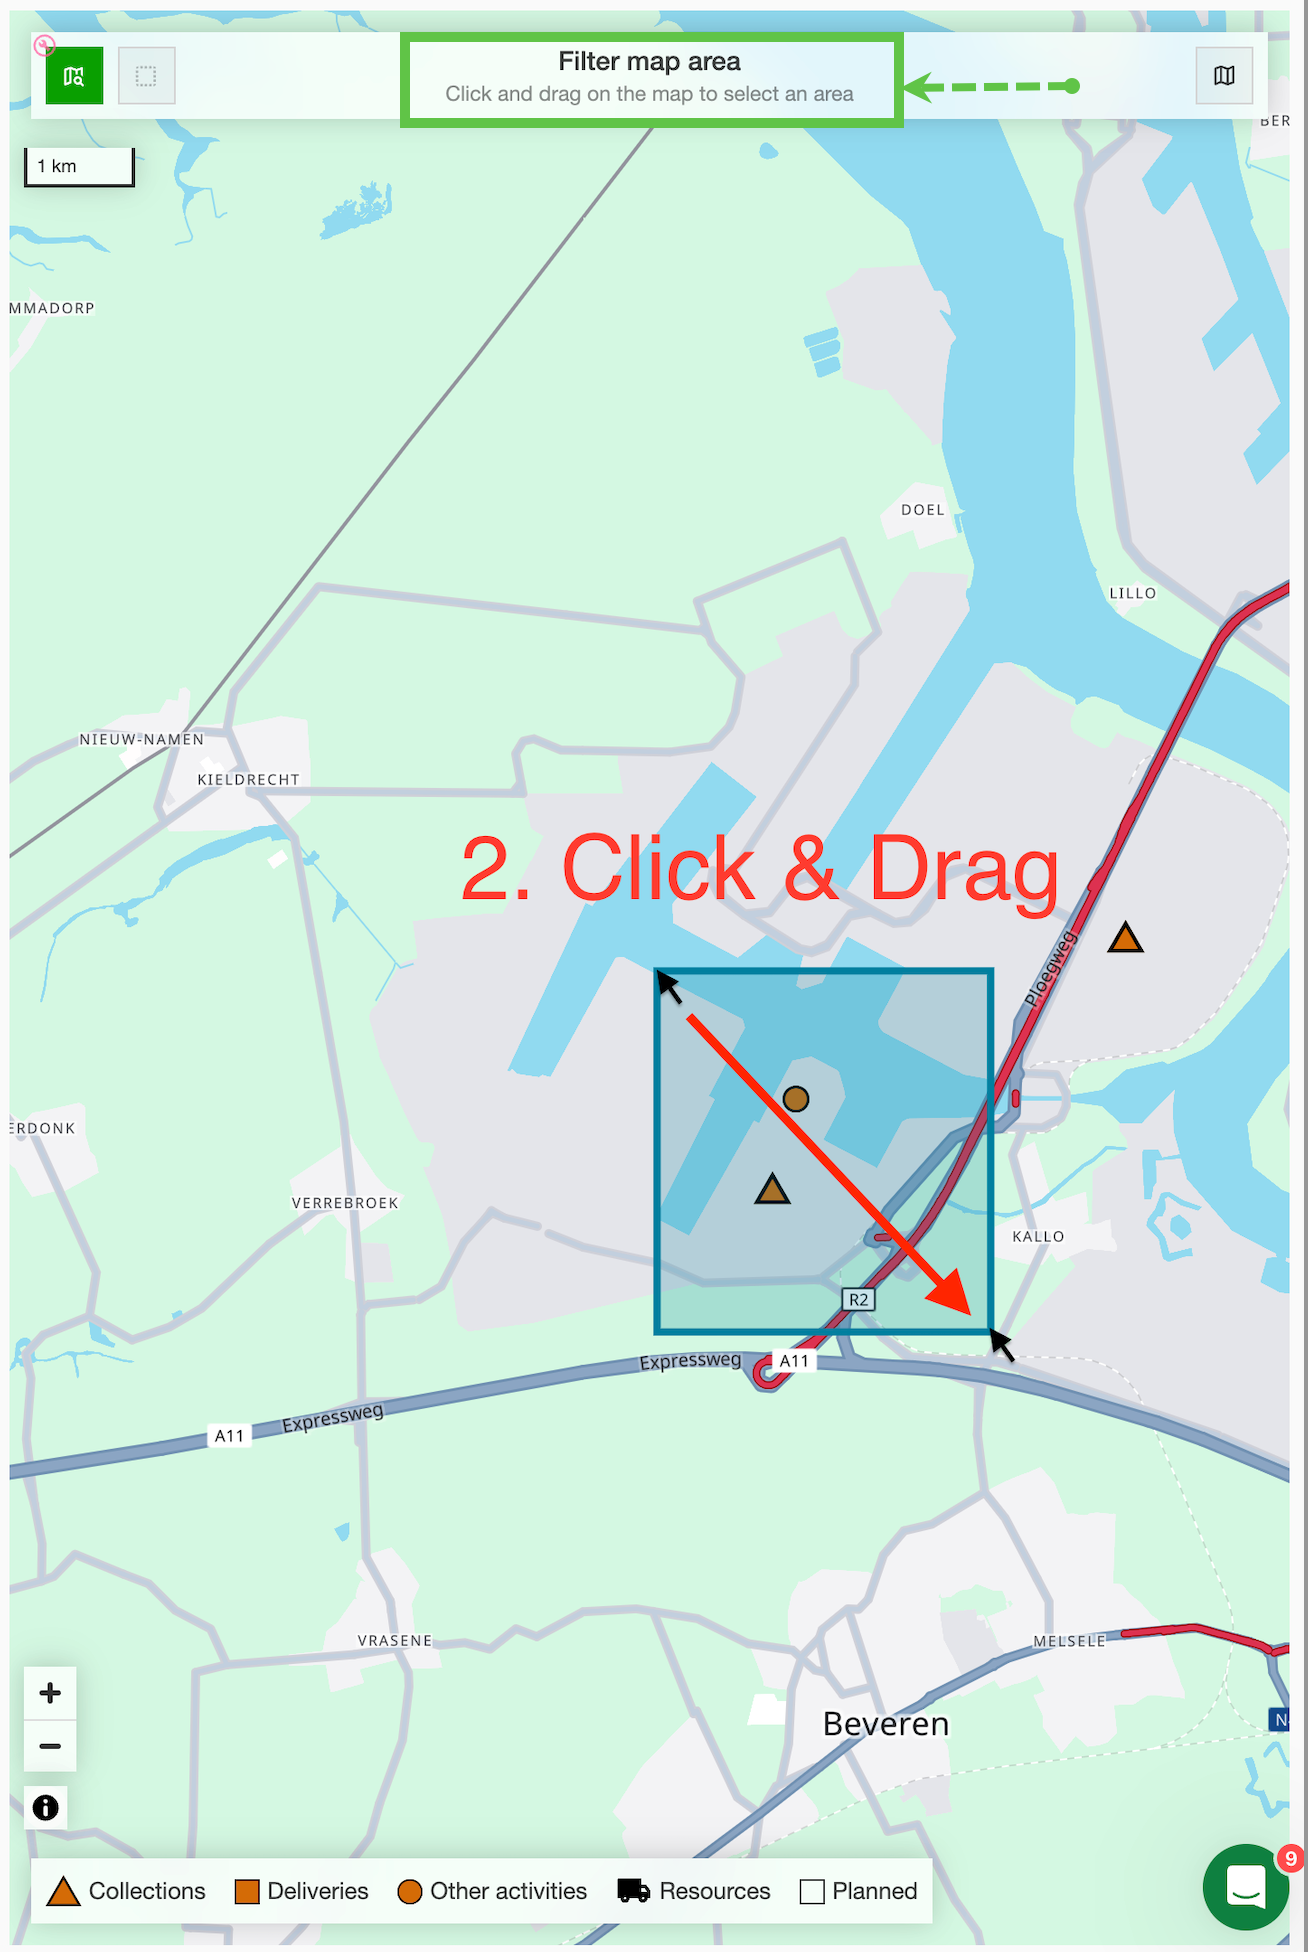
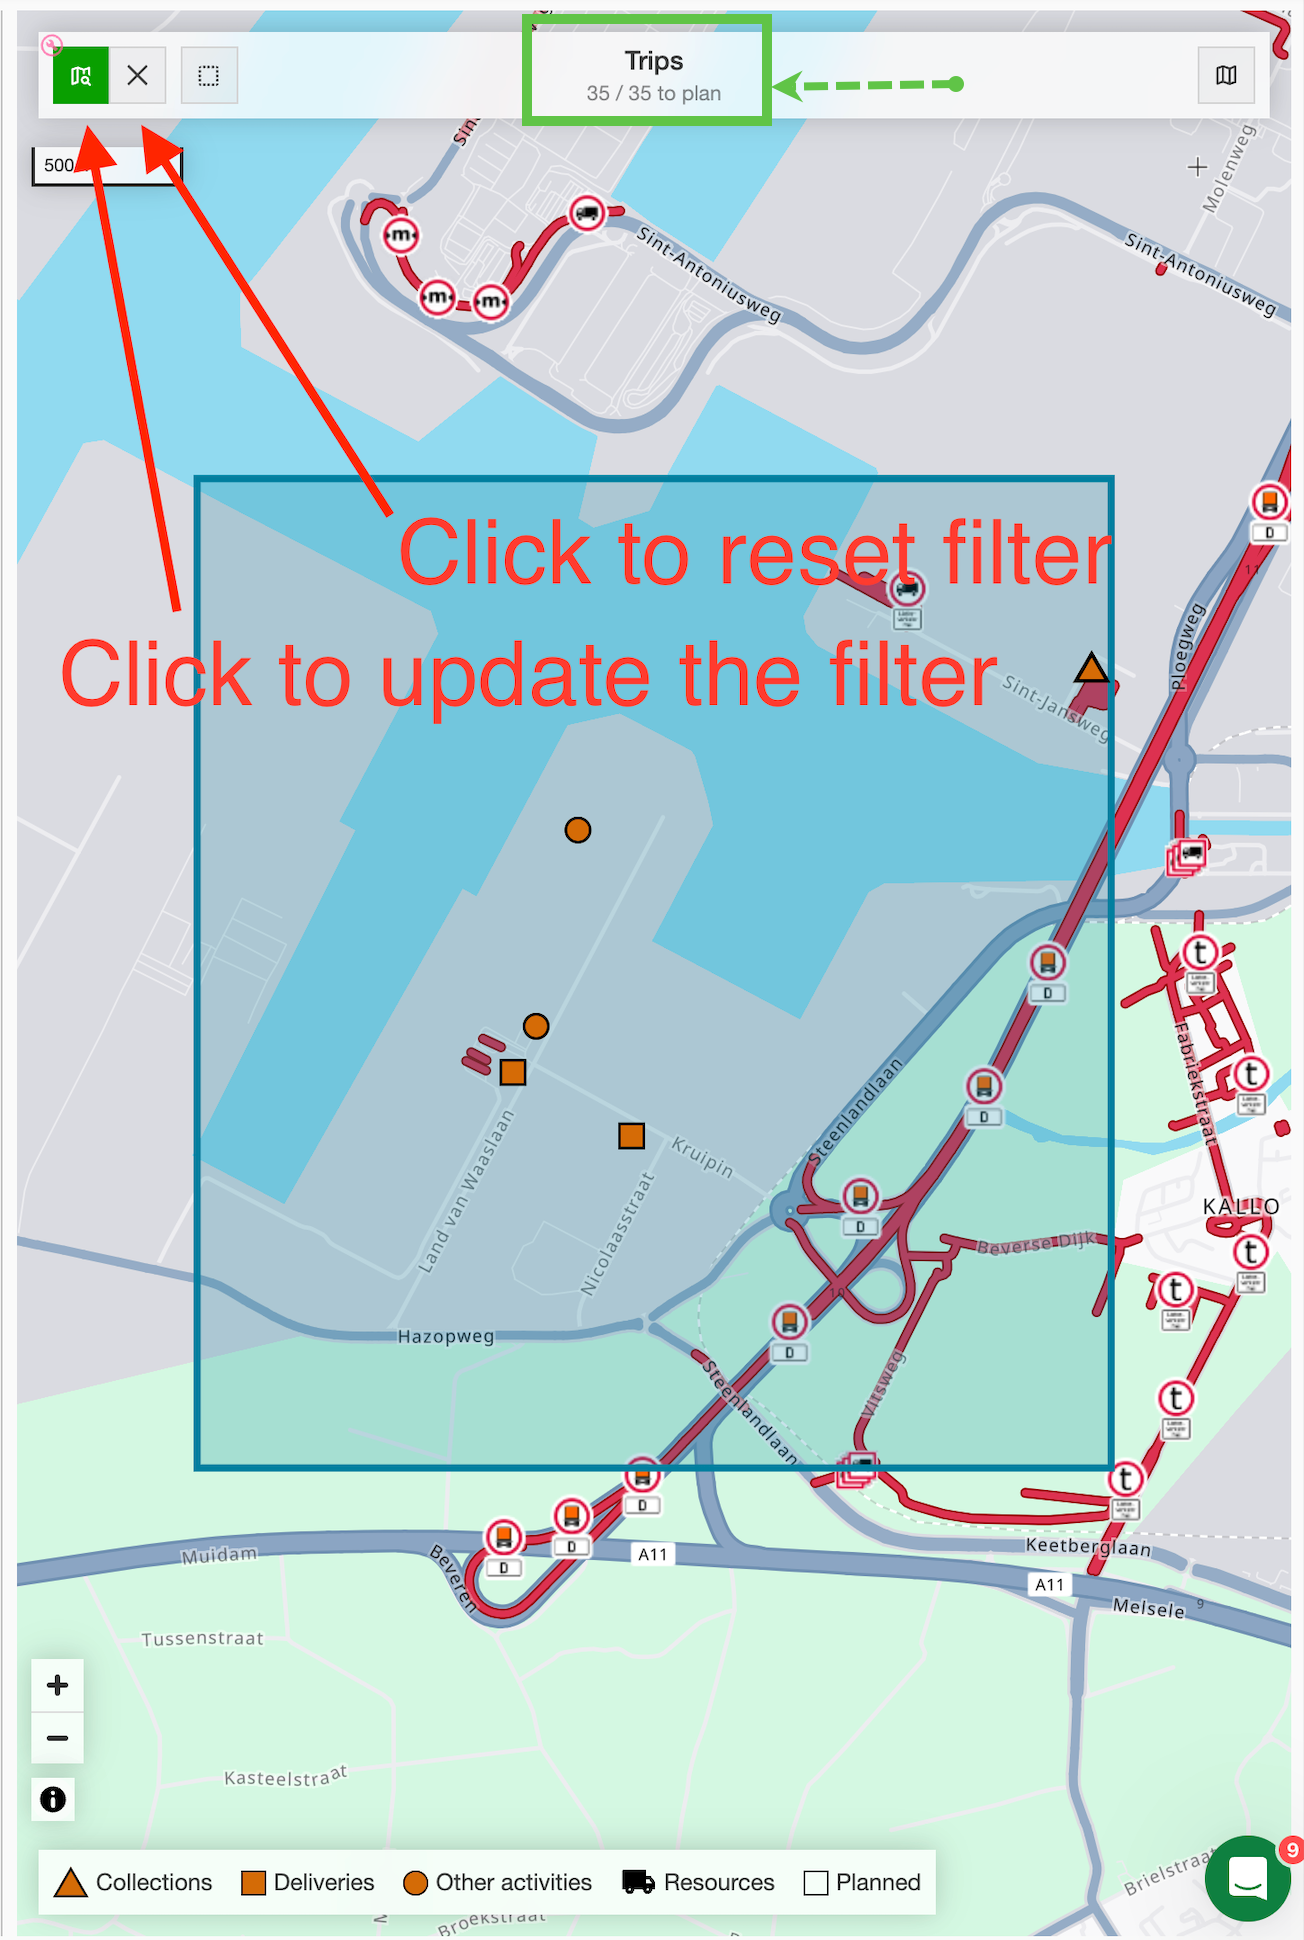
‘Filter on map’ function
- Define the area to select orders more precisely, instead of including all orders within the visible map area.
Locations
- This function can be used to select multiple locations at once, which is useful for merging locations.